Wind Farm Designer and Wind Farm Reporter
To book a demo click here
Introduction
Customise and create a wind farm in an easy-to-use interface, positioning turbines, anchors, and mooring lines. Quickly generating scenarios for simulation and optimisation.
The tool integrates with global wind atlas to show and utilise low-resolution Met-ocean data. Serving historical average wind speed, power, density, frequency with wind rose as reactive metadata at a point (turbine location). Other features include:
- Enhanced FieldTwin yield calculator for realistic AEP utilising Pywake.
- Integrated with Topfarm for wind farm optimisation based on AEP.
- XLS reporting to allow parallel reporting with rapid scenario comparison using XLS reporting as the backbone.
Wind Farm Designer
Setup
Location
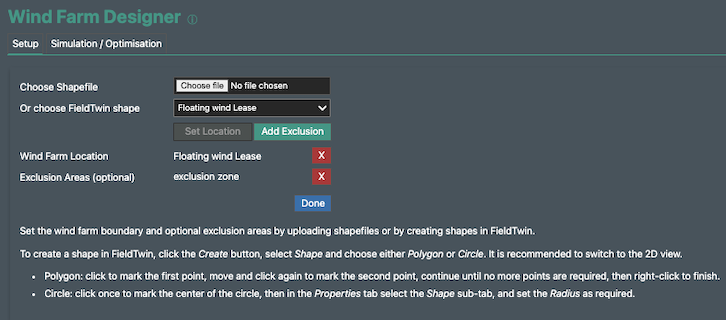
The user will use this tab to set the location of their wind farm based on a polygon drawn in FieldTwin or a shape file that is uploaded. Exclusion zones can also be added, by either choosing the exclusion zone shape in the dropdown list of shapes or by uploading a shape file. The exclusion zone will then be visible in the preview.
Farm Setup
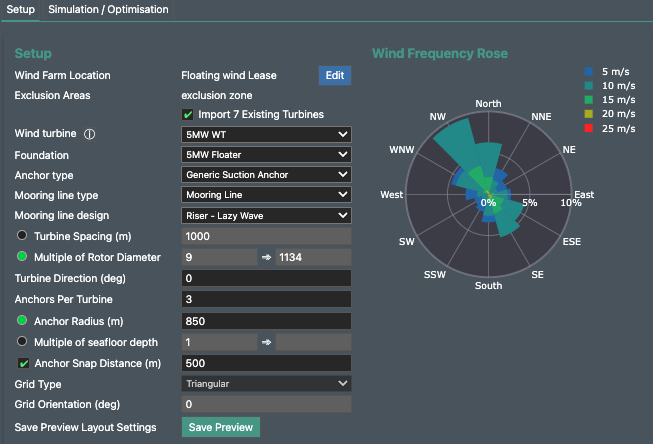
Import Existing Turbine Locations
A check box is available to click on if there are turbines pre positioned inside the lease area which can be imported and used for simulations, optimisations or to be replaced with different turbines and mooring line configurations.
Wind Turbine
Select a turbine from either the FieldTwin generic library or for any custom assets that have been added to your library.
Foundation
If using smart assets it is possible to select different types of foundation to match the environment your project is in.
Anchor Type
The anchor type can be selected from the asset library available in FieldTwin
Anchors per Turbine
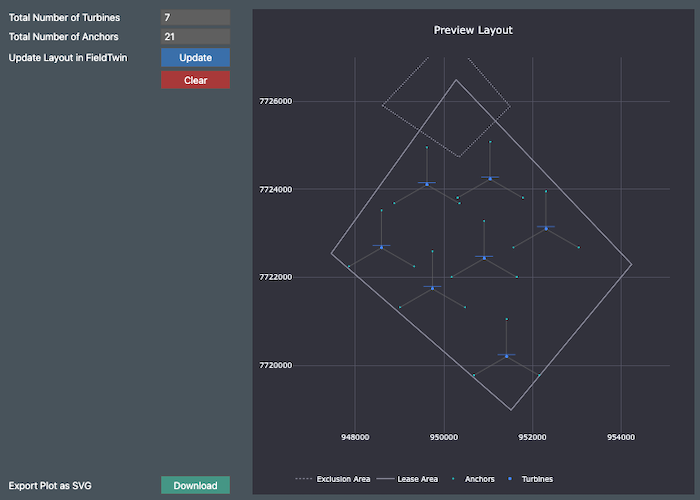
The number of anchors per turbine can be selected and the mooring line will be drawn between the connection points on the turbine and the anchors. This is visualised in the Preview window.
Mooring Line Type
The type of mooring line can be selected from a dropdown list taken from the object settings and connection settings in FieldTwin docs
Mooring Line Design
The design type can be chosen depending on how the user would like the mooring line to be displayed. Information about this can be found here
Turbine Spacing
Turbines can be spaced either by meters or a multiple of the rotor diameter. Allowing for minimum safety standards to be applied to your wind farm.
Turbine and Foundation orientation
Turbines and foundations can have their orientation manually applied to fit the met ocean conditions.
The chosen mooring line or anchor configuration can mean that the foundation has to have a different orientation than the turbine.
Anchor radius (m) and depth multiplier
The minimum anchor radius from the turbine
Anchor snap distance
The Snap distance, which is if the anchors from different turbines are within the set distance, they will share the same anchor.
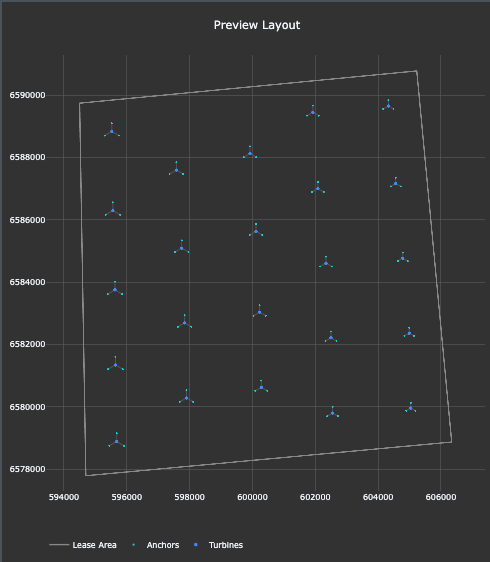
Grid type
There are 3 types of grid available:
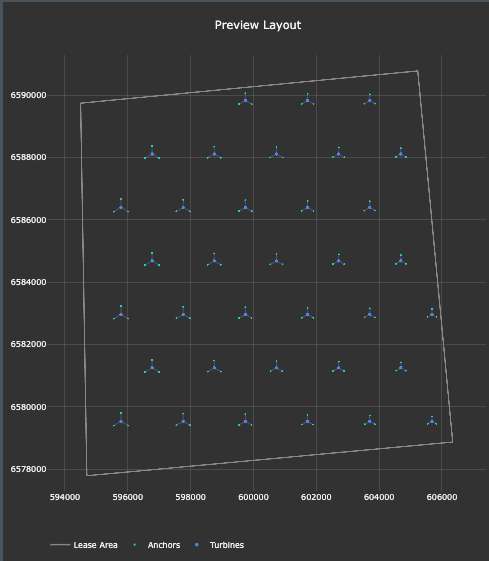
Rectangular
Triangular
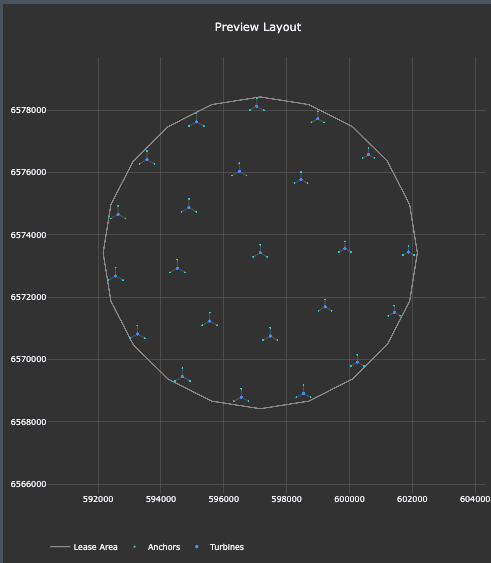
Radial
Grid Orientation
If the farm needs to be orientated towards a particular direction this can be done here.
Generate/update layout
By clicking the generate button the farm that is visible in 2D in the preview window will be then deployed to the Viewport so that you can view your wind farm in 3D in context.
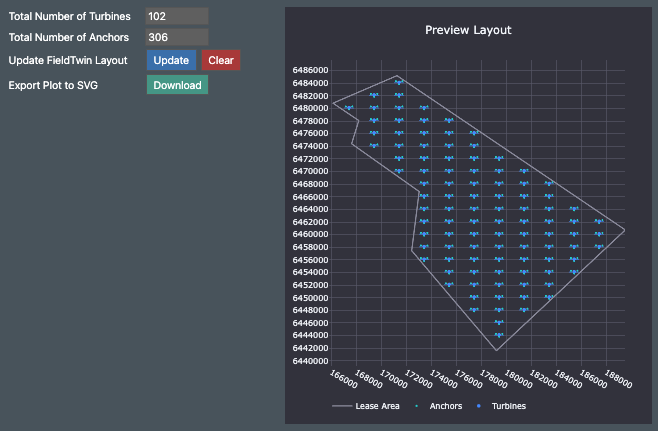
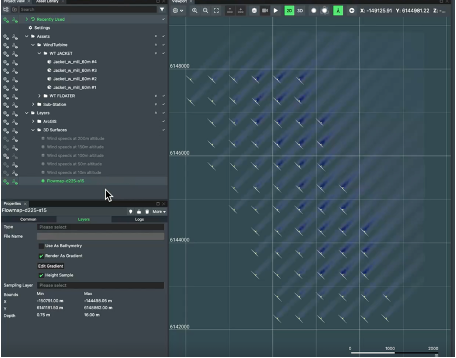
Preview window
Preview window settings
Simulation/Optimisation
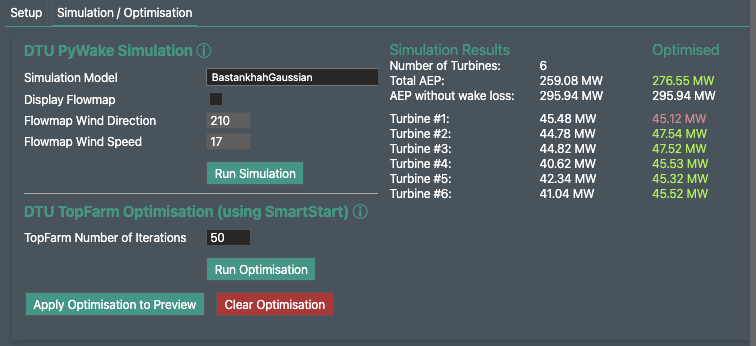
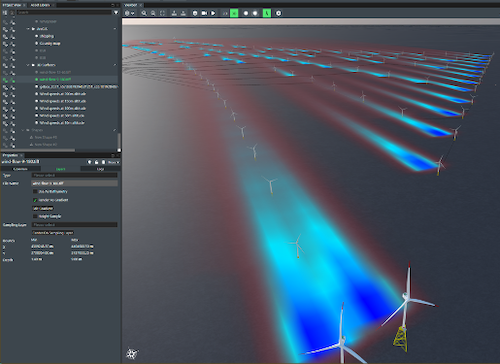
Pywake Simulation
The user can select the type of simulation model from the dropdown list. Pywake documentation
- To display the flow map in the viewport the tick box has to be clicked.
- Then the user defines the flow map wind direction in degrees and the flow map wind speed in M/s
- After running the simulation, it returns a flow map and a table of results for each turbine, giving a total AEP with and without Wake losses.
- Allows the user to consider the loss in potential yield as a function of interference / wake from neighbouring turbines
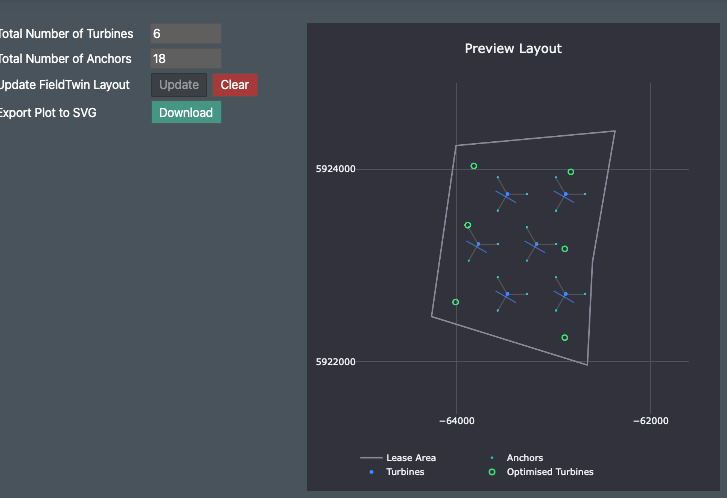
Topfarm Optimisation
The user can select the type of simulation model from the dropdown list. Topfarm Documentation
The optimisation uses TopFarm, in the first version this is carried out to optimise in relation to AEP. So, it returns an optimised position for each turbine relating to the wake effect and the AEP implications of that wake effect on AEP in the wind farm. Topfarm relies on Pywake for the information needed in order to create a new optimised layout.
- Builds on the PyWake model and support automated layout optimisation of the entire farm – including cables
- Integrates spatial constraints, bathymetric constraints, LCOE and IRR hurdles and offers highly customisable modelling workflows
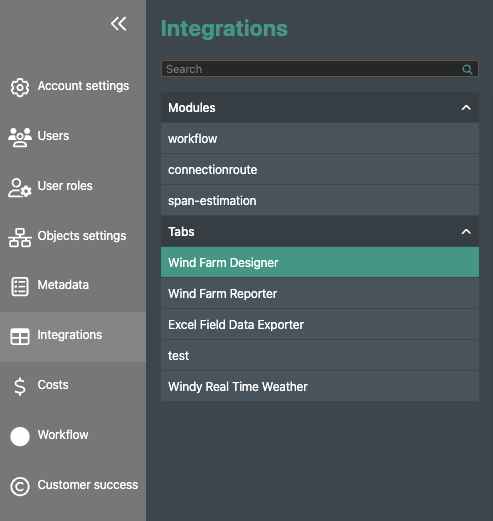
Wind Farm Designer Settings
With account administrator access, Users can adjust the wind farm designer settings in FieldTwin Admin, under the integrations tab,
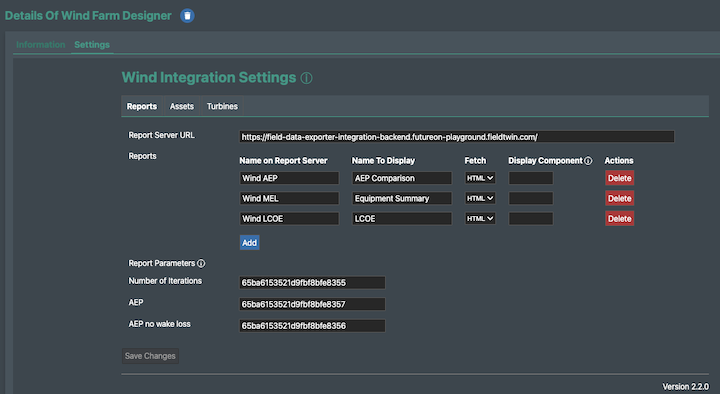
Reports
The reports tab is usually setup by the customer success manager and account administrator for the account, the report server url.
The reports themselves used in wind farm reporter are assigned here, the reports themselves are setup in the Excel Reporting Tool.
Report parameters
The number of iterations, AEP and AEP with no wake loss are unique ID's that are linked to the turbine metadata values, if using the standard metadata setup, these values are created on the integrations setup by customer success and don't need to be changed.
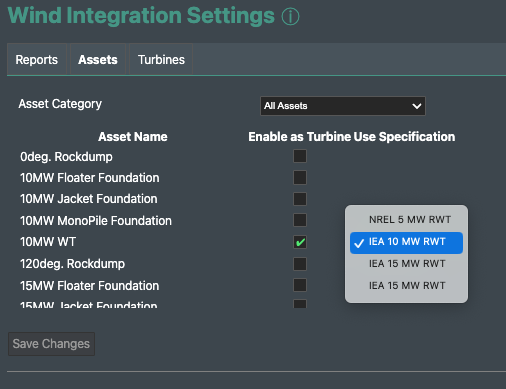
Assets
The Asset tab is for the user to assign Turbines to the corresponding metdata sets. This allows the optimisation and simulation workflows to use the correct turbine attributes.
The asset category can be selected and then the user can select a check box next to the turbine and the corresponding turbine specification can be selected from the dropdown
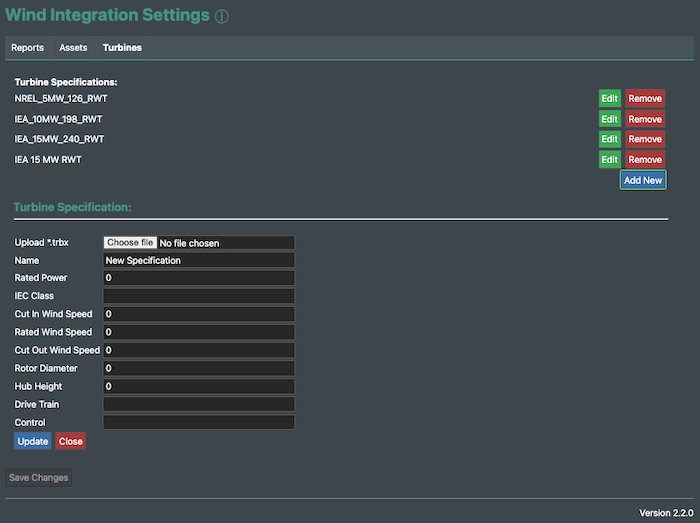
Turbines
Turbine specifications can be viewed, edited, removed and new specifications can be added here.
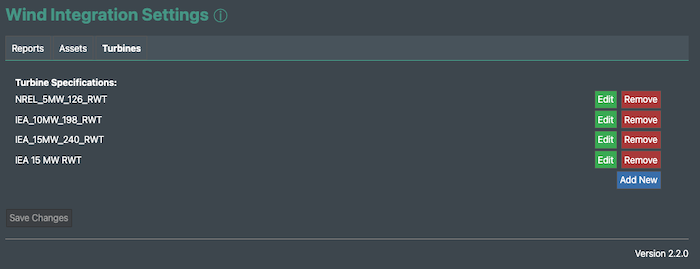
To edit the specs of a turbine, click on edit and then the metadata can be updated.
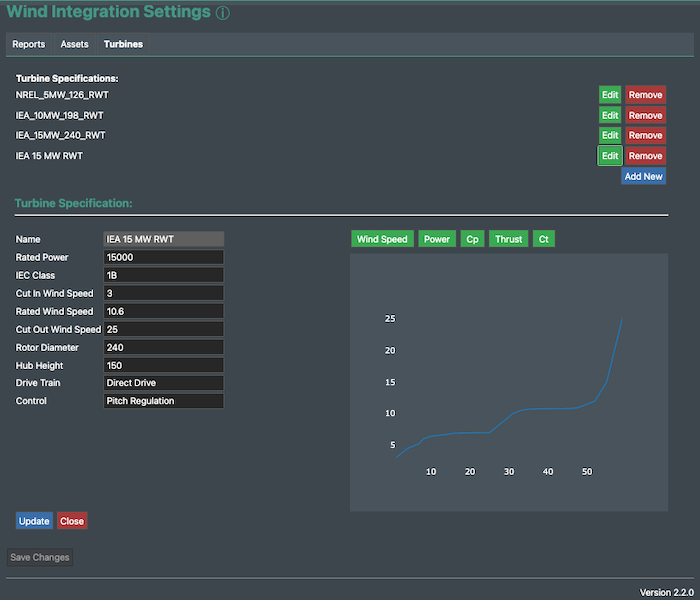
To add a new specification, click on add new, then choose a file to upload. The file type currently supported is .trbx, once uploaded all of the metadata values and power curves are automatically populated.
Wind Farm Reporter
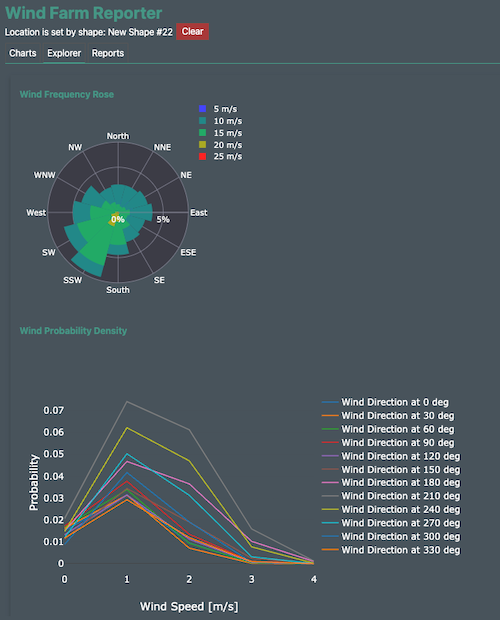
Explorer
This allows the user, when clicking on Turbines inside the wind farm in FieldTwin to show data related to that turbine:
- Display weather data for selected turbine at turbine hub height
- average wind speed and density
- Graphical wind rose
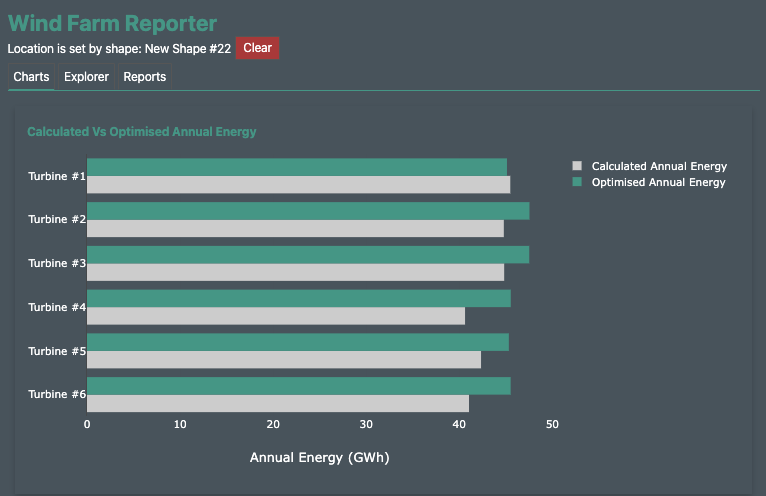
Charts
This tab will display the results in chart format comparing turbines AEP before and after optimisation. There will be wind data displayed in the form of a wind rose for Power, density, wind speed wind roses… There might be the possibility to compare between simulation results to help choose the best wind farm layout.
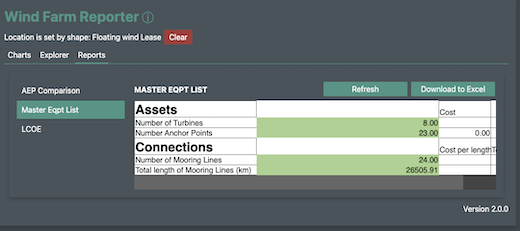
Reports
The reports available compile 3 aspects of the wind farm and various wind farm scenarios. It allows for the comparison of AEP before and after optimisation and a separate report for the equipment used in the wind farm.
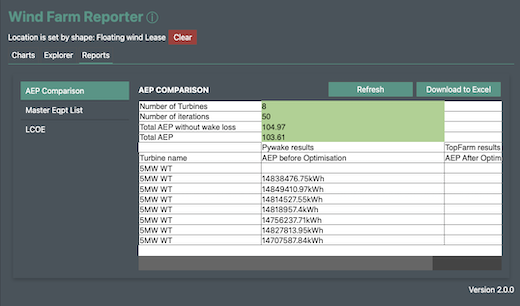
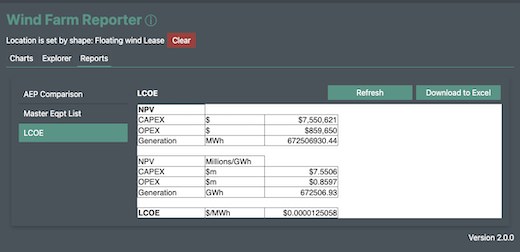
The report function allows the users to customise and create reports that can be downloaded to excel. The report function utilises our existing reporting framework.
The reporting functionality is supported by our excel reporting integration.