Excel Reporting Tool
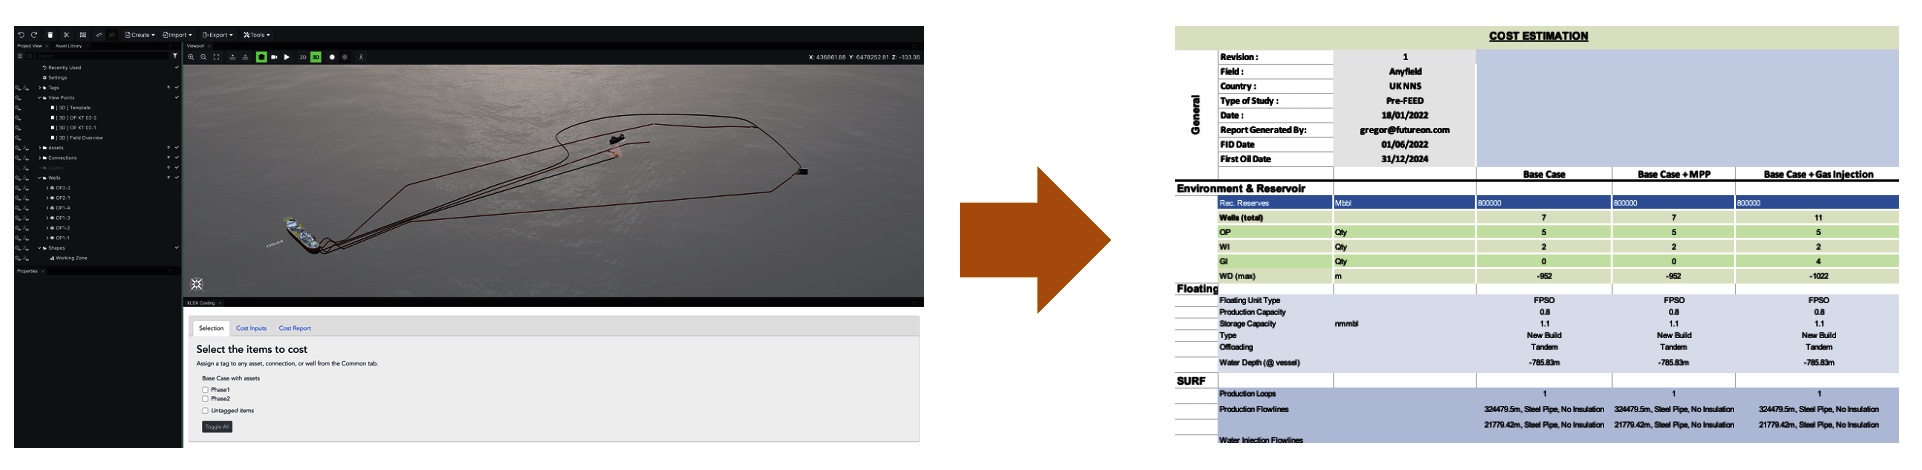
The FieldTwin Excel Reporting tool allows the generation of a cost report for any sub-project(s) based on a predefined Excel spreadsheet and configuration file. The Excel spreadsheet is automatically populated from FieldTwin based on asset and connection properties, metadata and quantities. User defined parameters created in FieldTwin can also be used to populate the Excel sheet.
GETTING STARTED
The cost report can be generated from the XLSX Costing tab. To display this tab, click on the Layout button at the top left and select XLSX Costing from the list of available tabs.
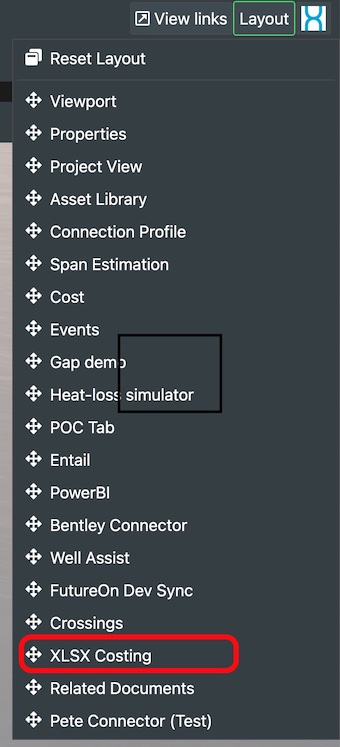
If the XLS Costing tab is not shown an option please contact
your FutureOn Sales or Customer Success representative.
A cost report template (Excel XLSX format) and configuration file are required. The importing and configuration of these files is detailed below.
GENERATING A COST REPORT
Grouping equipment for costing
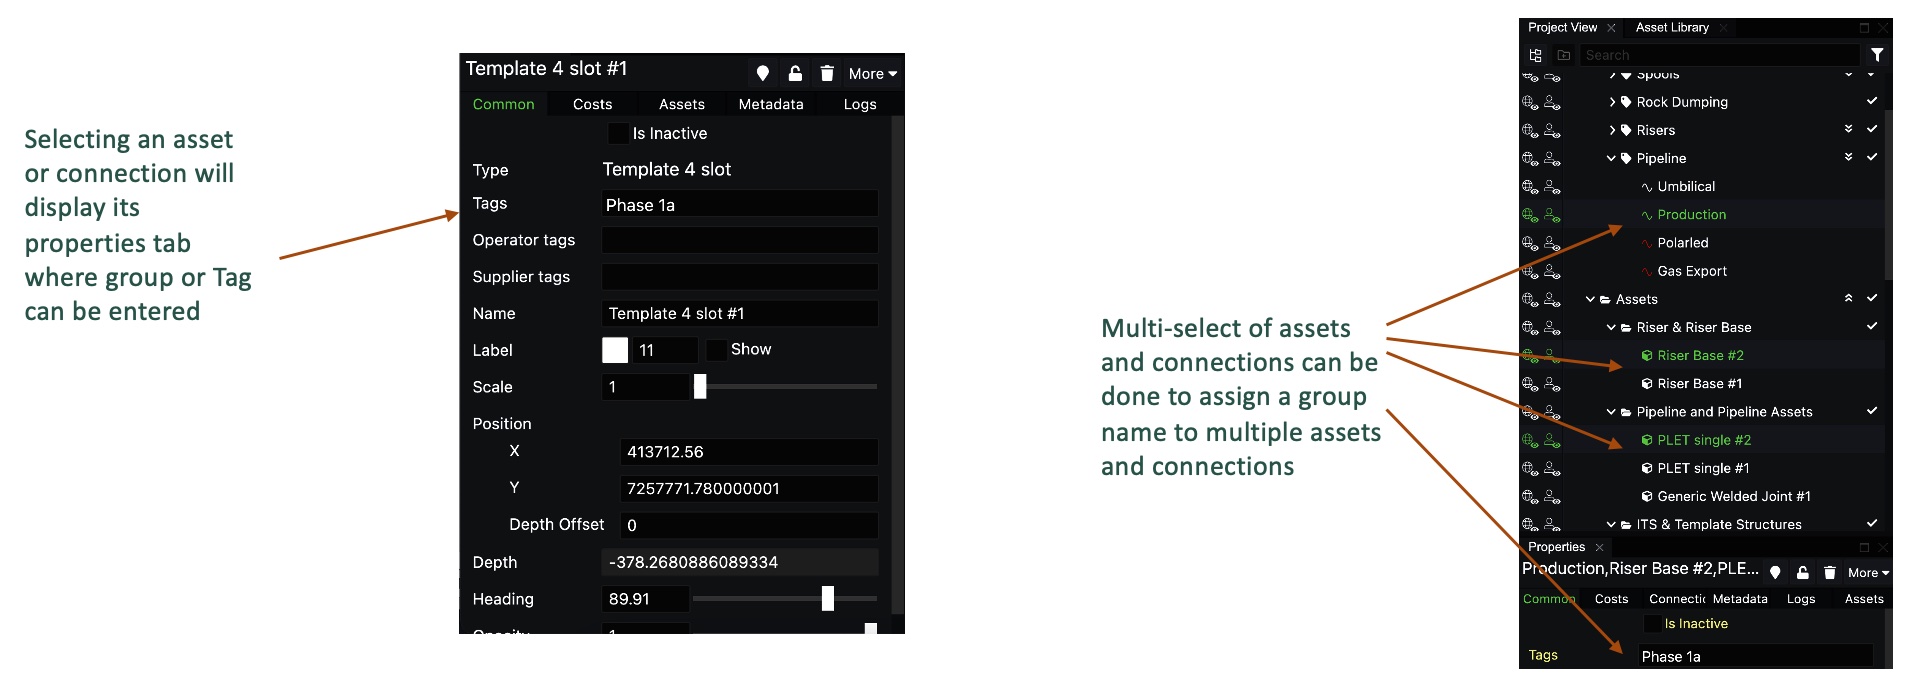
Every asset, well and connection in FieldTwin can be given a group name (tag) allowing equipment to be grouped together for a particular project phase, production loop, etc. This tagging allows the user to group assets and connections to be included in the Excel cost report.
More information on tags can be found here
Selecting equipment for costing
The first tab on the XLSX Costing tab allows a user to select the items to cost. If tags have been used then all the tag groups will be displayed for selection. Any equipment which does not have a tag will be grouped in Untagged Items. To select assets and connections without tags select the 'Untagged Assets' option. Multiple tag groups can be selected.
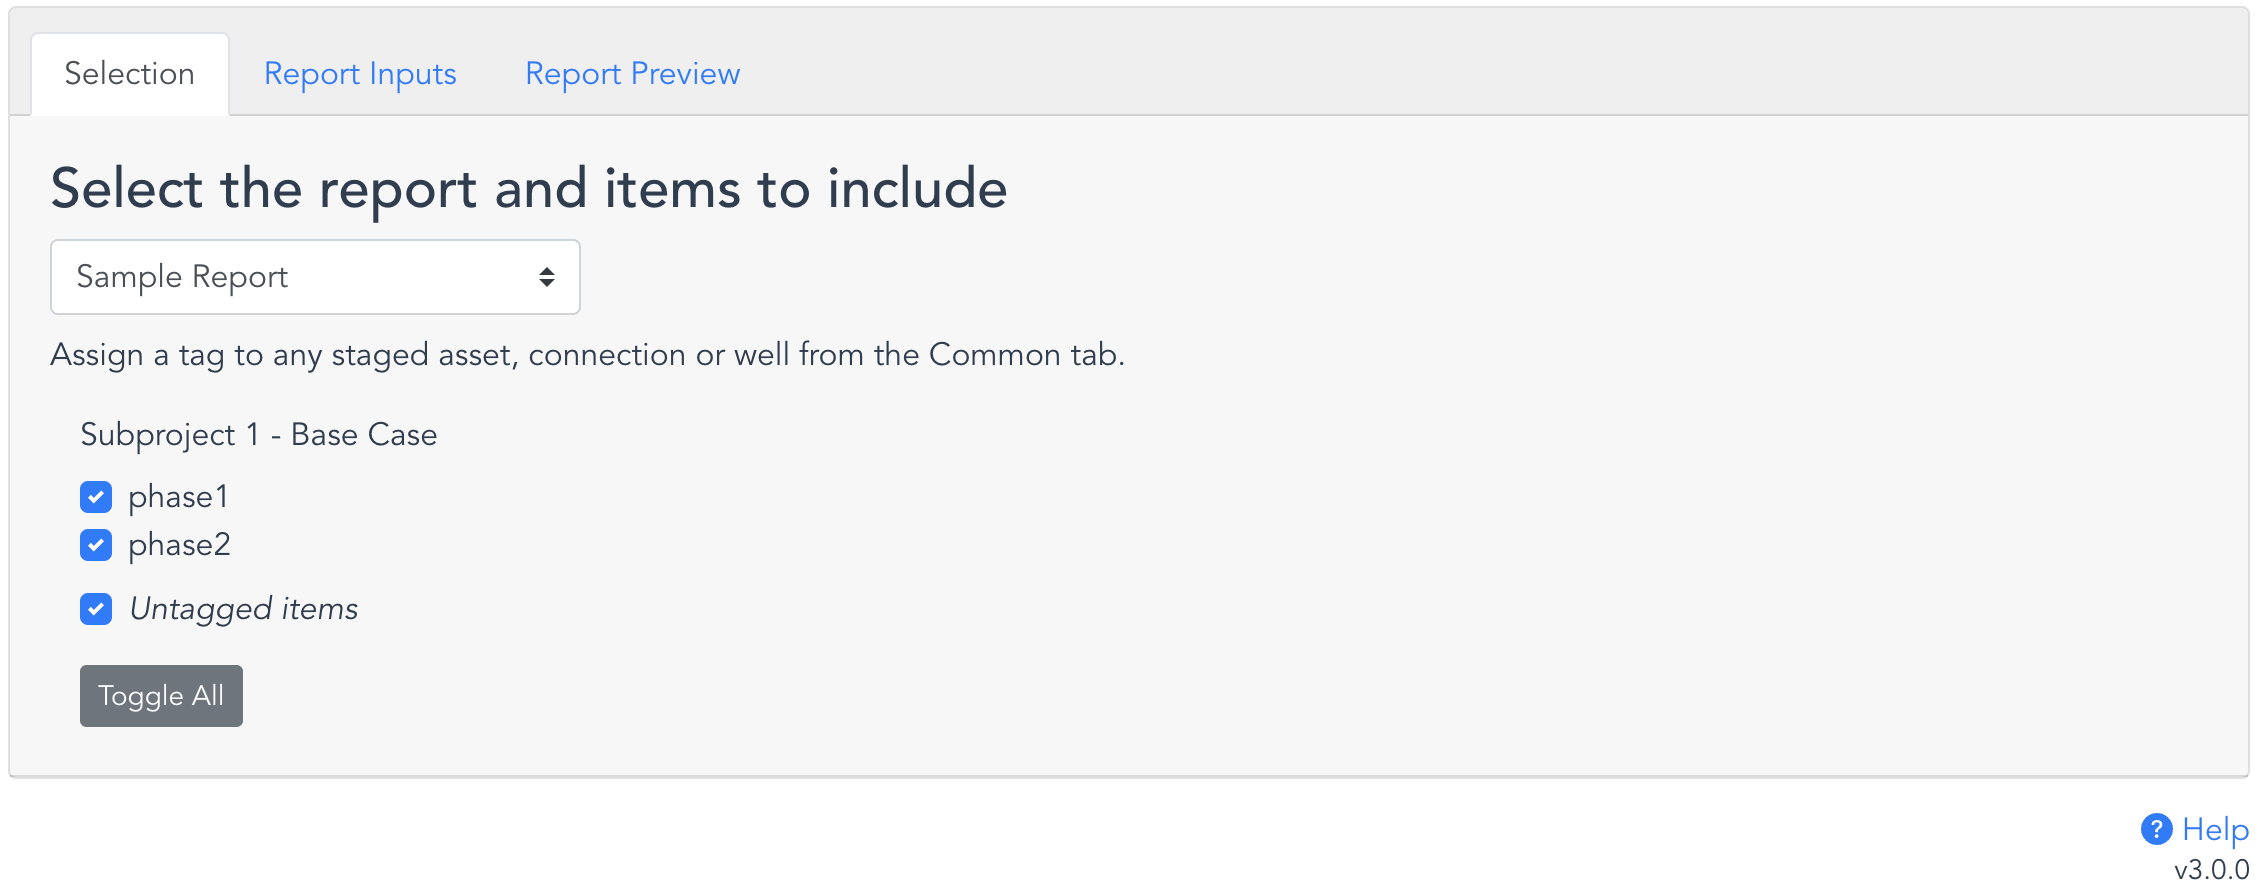
The Toggle All button will select or de-select all the tag groups listed.
Configure additional cost input data
The second tab allows a user to enter values for the configurable parameters to be used in the cost report.
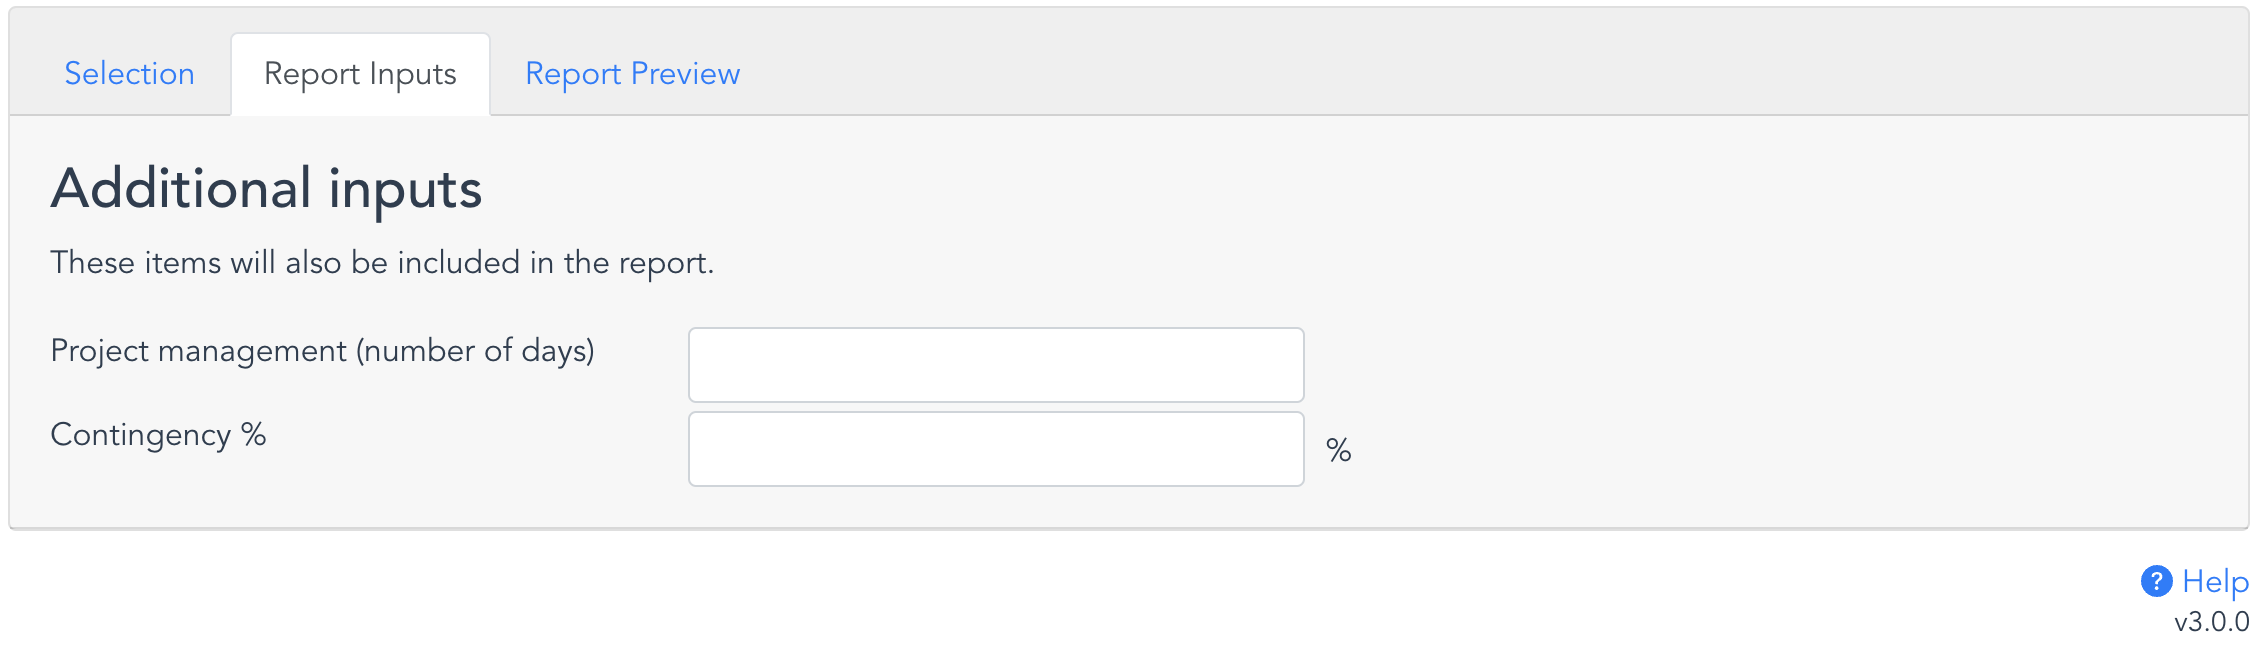
These parameters can be pre-defined in the Adminstration page described below.
Generate the Cost Report
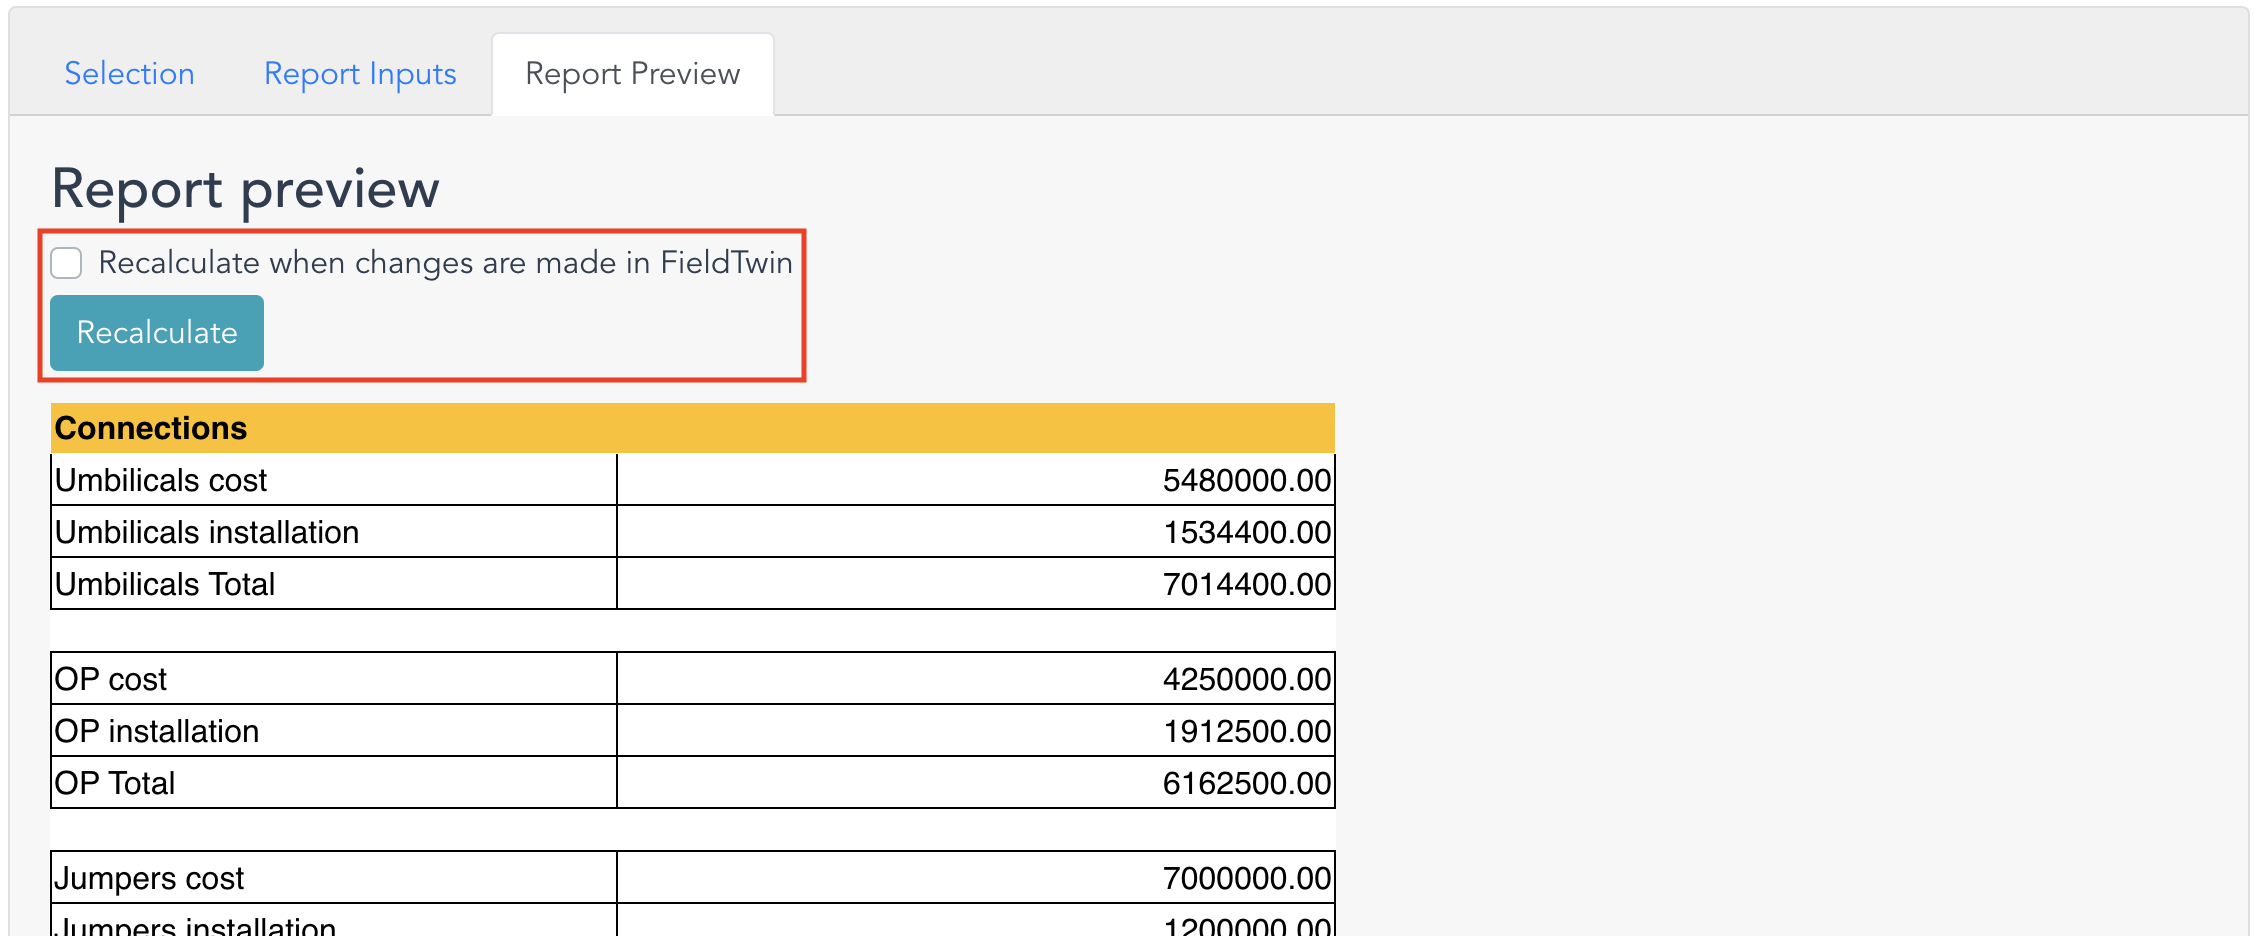
Clicking on the Recalculate button will initiate the generation of the cost report. The report will be displayed in the tab in the same format as the Excel sheet. Selecting the 'Recalculate when changes are made in FieldTwin' checkbox will mean the cost report will be recalculated each time an asset or connection is changed in the project.
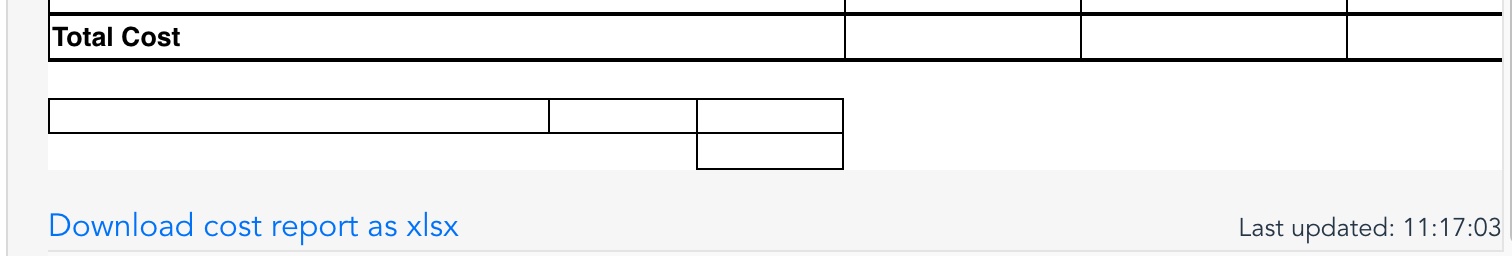
Scrolling down to the end of the report will show an 'Download cost report as XLSX' allowing the user to download the report as an Excel file.
CONFIGURING A COST REPORT
Account administration access is required to upload and modify the cost report and configuration files.
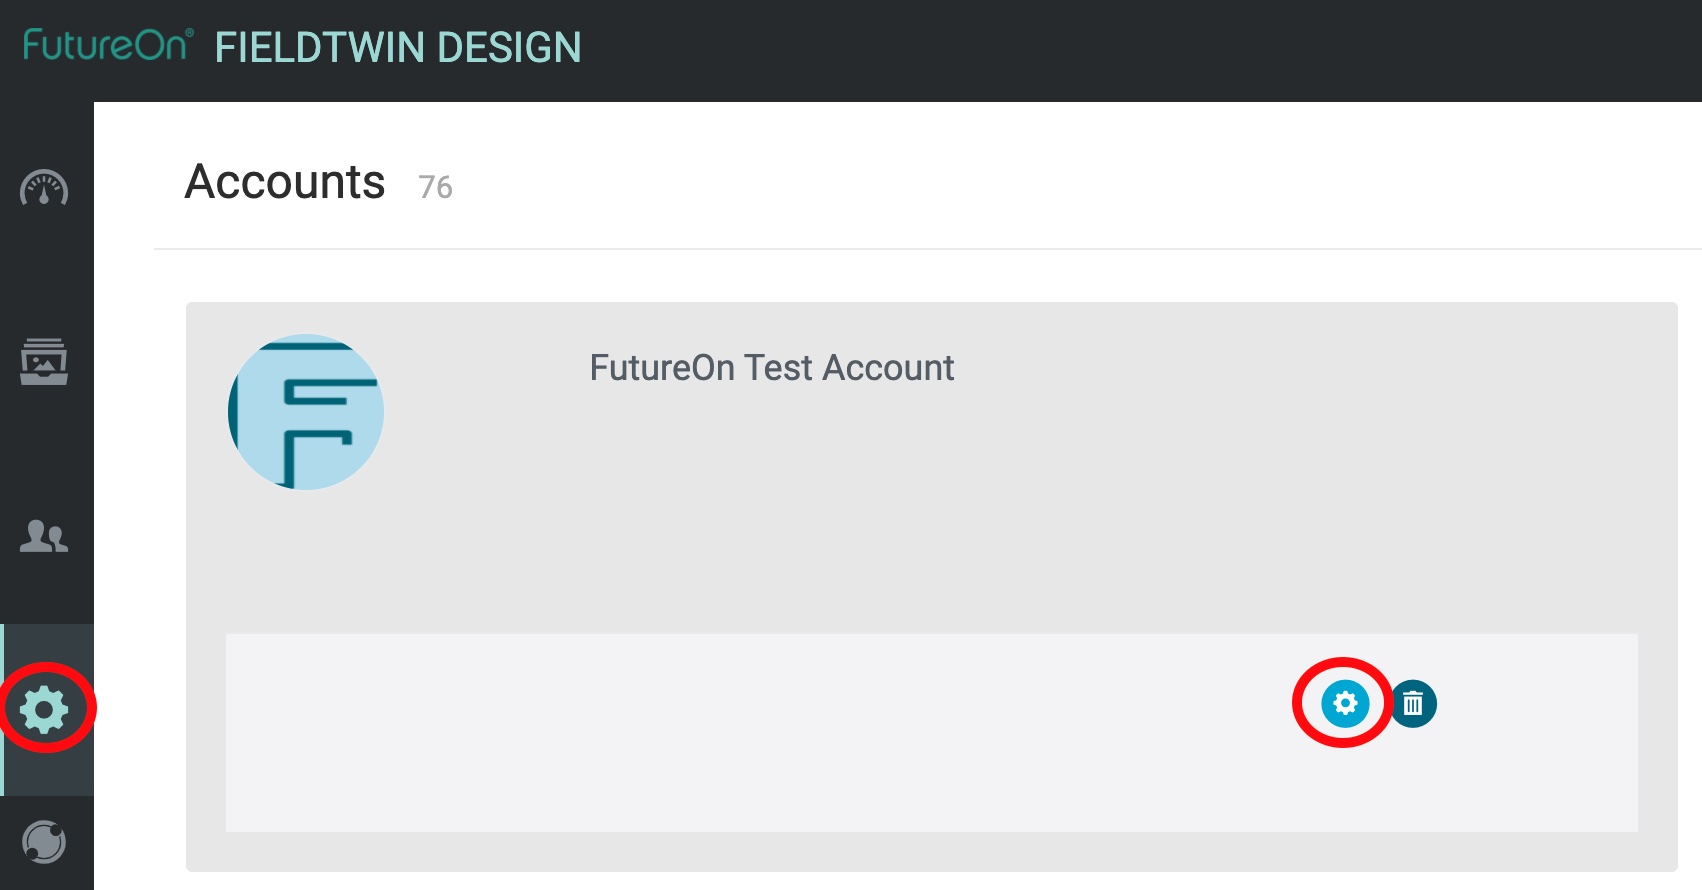
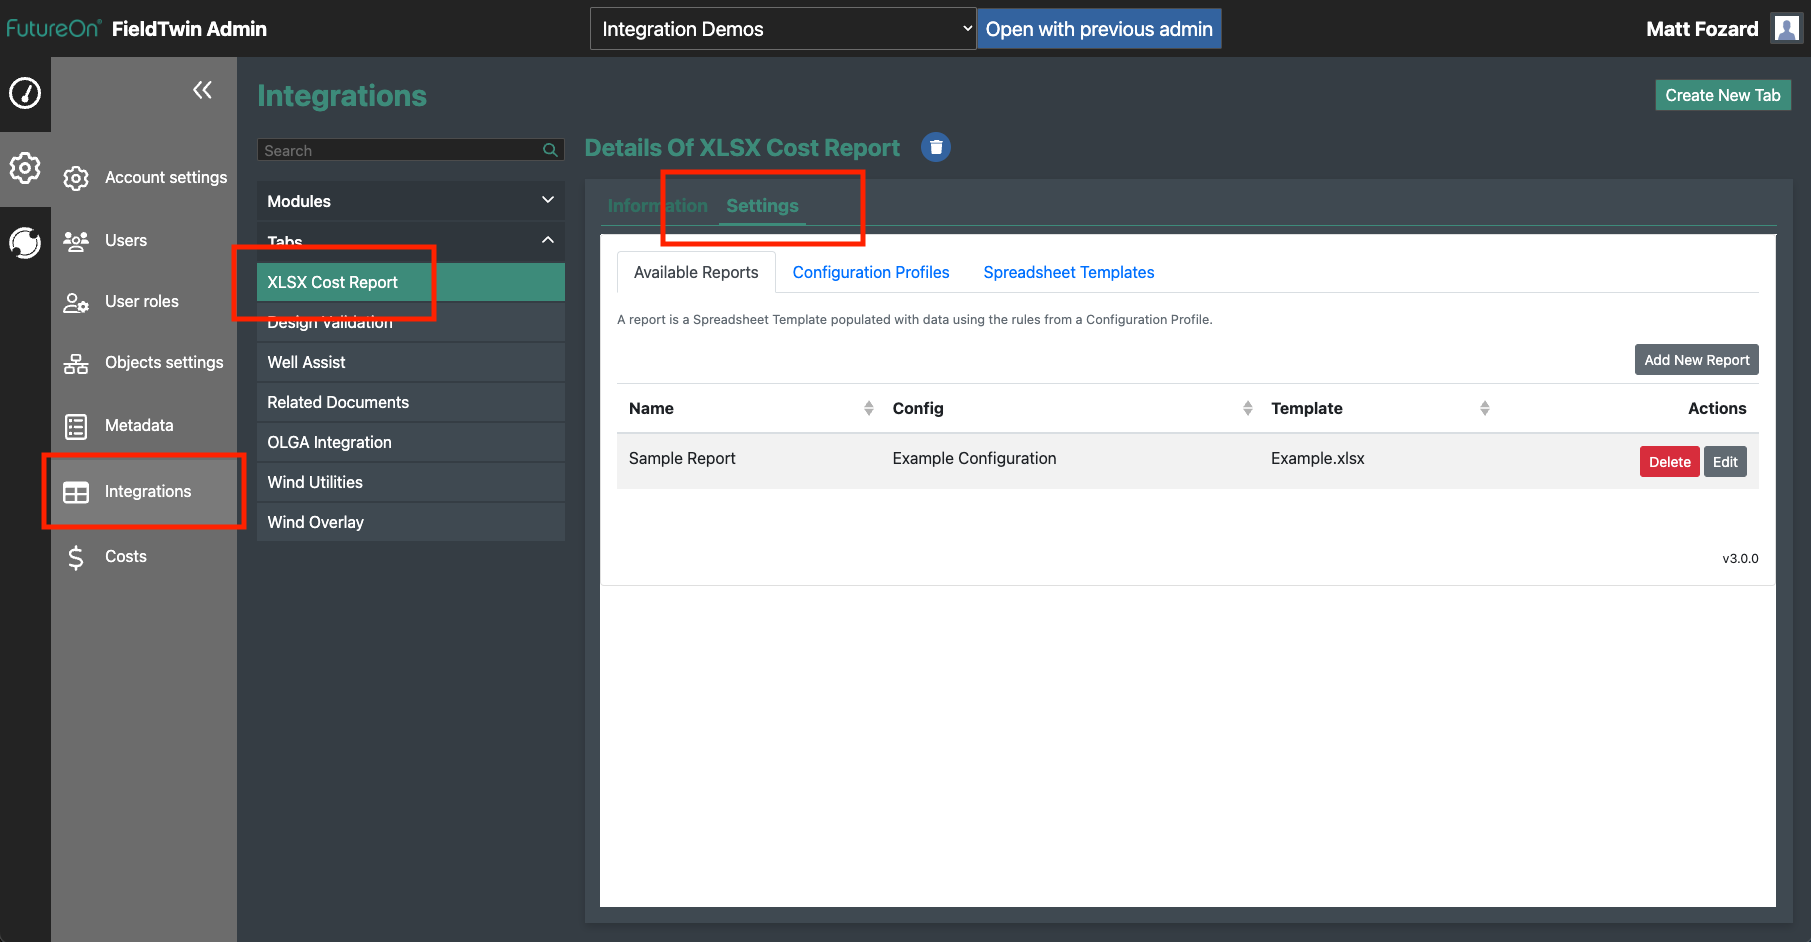
To access the Cost Report configuration page, go to the Account Settings page and click on Integrations, then XLSX Costing, then Settings. This will open the Configuration Page show here.
Two files are required for the generation of a cost report:
- Spreadsheet Template - Excel cost report sheet which will be populated with the project data from FieldTwin. This Excel file can be pre-populated in the required format for the cost report and can include calculations and other Excel functions.
- Configuration Profile - This file defines how the asset and connection data including user defined parameters will be used to populated the spreadsheet template. The configuration can include information on the row and column to place the data into, and also provide filtering and text formatting for the data.
A Report is the combination of one Template and one Configuration Profile.
- The tool allows multiple reports to be defined
- The Templates, Profiles and Reports are stored in the selected account
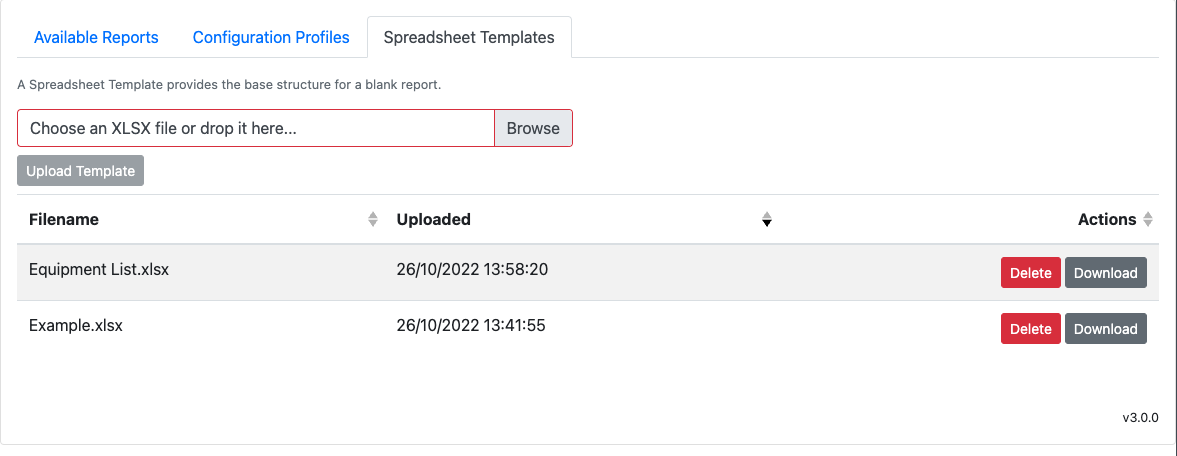
Adding a Spreadsheet Template
Navigate to the 3rd tab to manage the Spreadsheet Templates. The list of all templates is displayed, and each template can be downloaded or deleted (if it is not in use).
To upload a new template, click the Browse button or drag & drop an XLSX file onto the box, then click Upload Template.
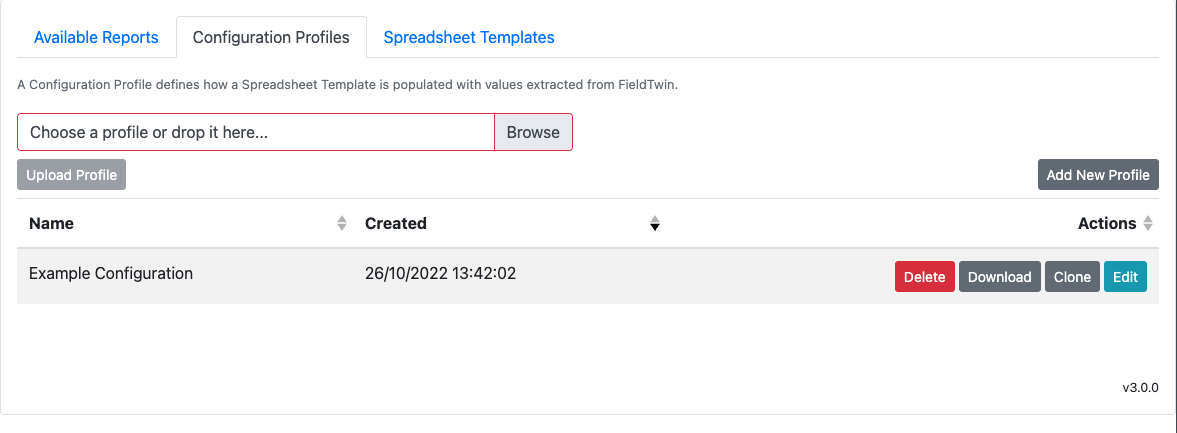
Adding a Configuration Profile
The 2nd tab shows the list of Configuration Profiles that define how to fill in a template. Each profile can be downloaded as a file, cloned, edited or deleted (if it is not in use). We recommend you clone a profile before it is edited so that you can roll back to the clone should the changes introduce any problems.
If you have previously downloaded a Configuration Profile you can re-upload it by clicking the Browse button, or by dragging & dropping a JSON file onto the box, then clicking Upload Profile. The download/upload function allows you to take backups and to move a profile between different accounts.
Click the Add New Profile button or click Edit next to an existing profile to show the profile editor at the bottom of the page. You may need to scroll down.
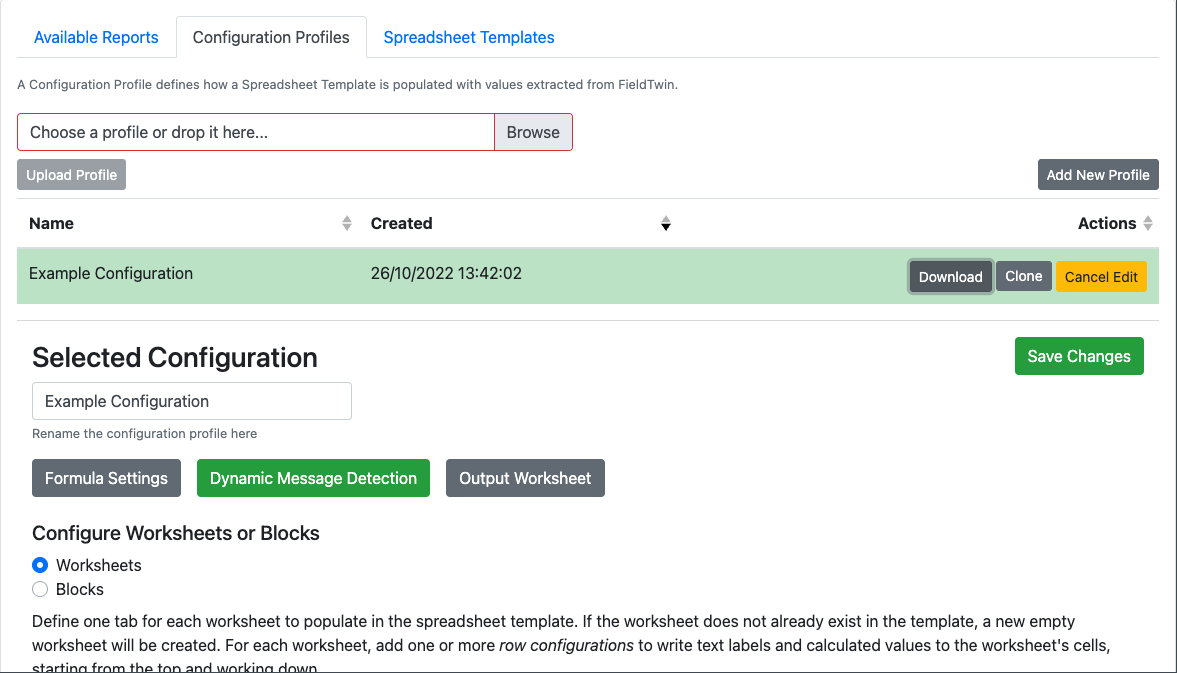
Three configuration options are available to support the Excel report creation, accessible from the buttons labeled as followed:
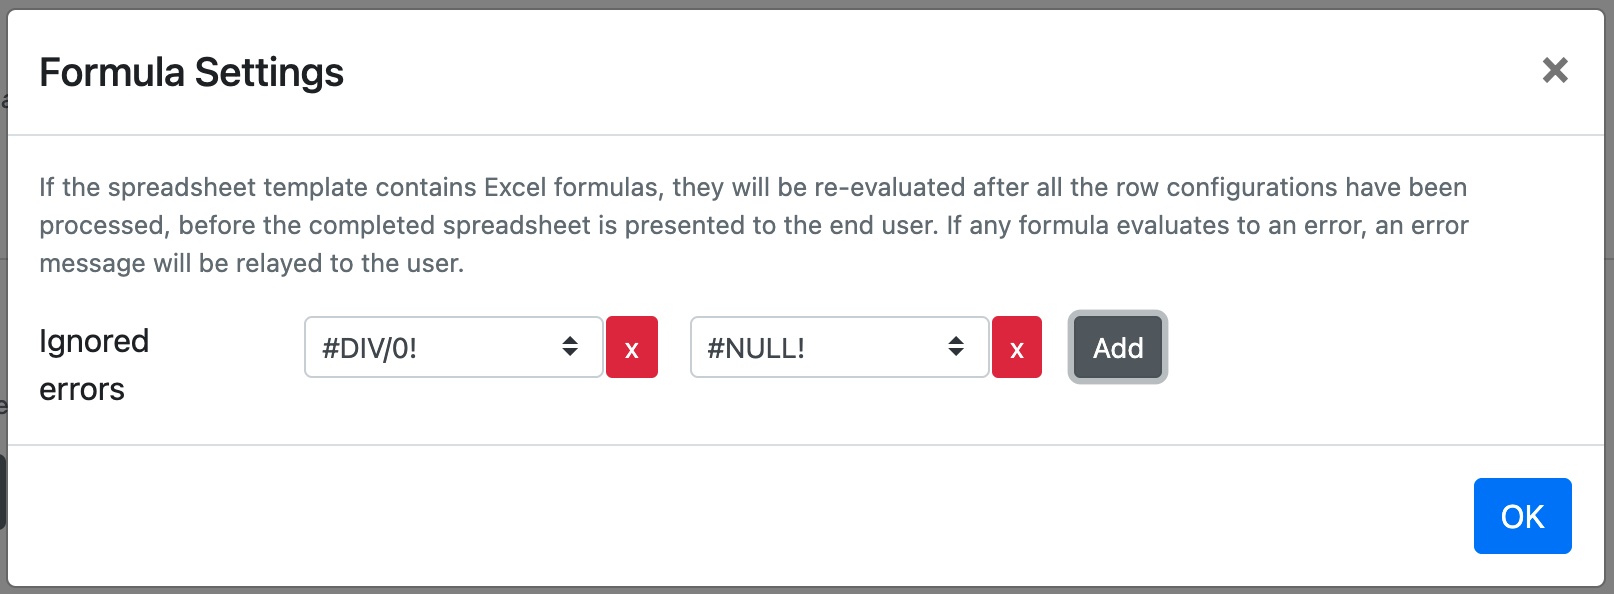
Formula settings
This option opens a dialogue box allowing the user to select which errors on the Excel worksheet, if any, should be reported to the user. The user can ADD multiple types of Excel error which should be ignored such as divide by zero (DIV/0), #NULL, etc. Any errors which are not selected to be ignored will be presented to the user when the report is generated.
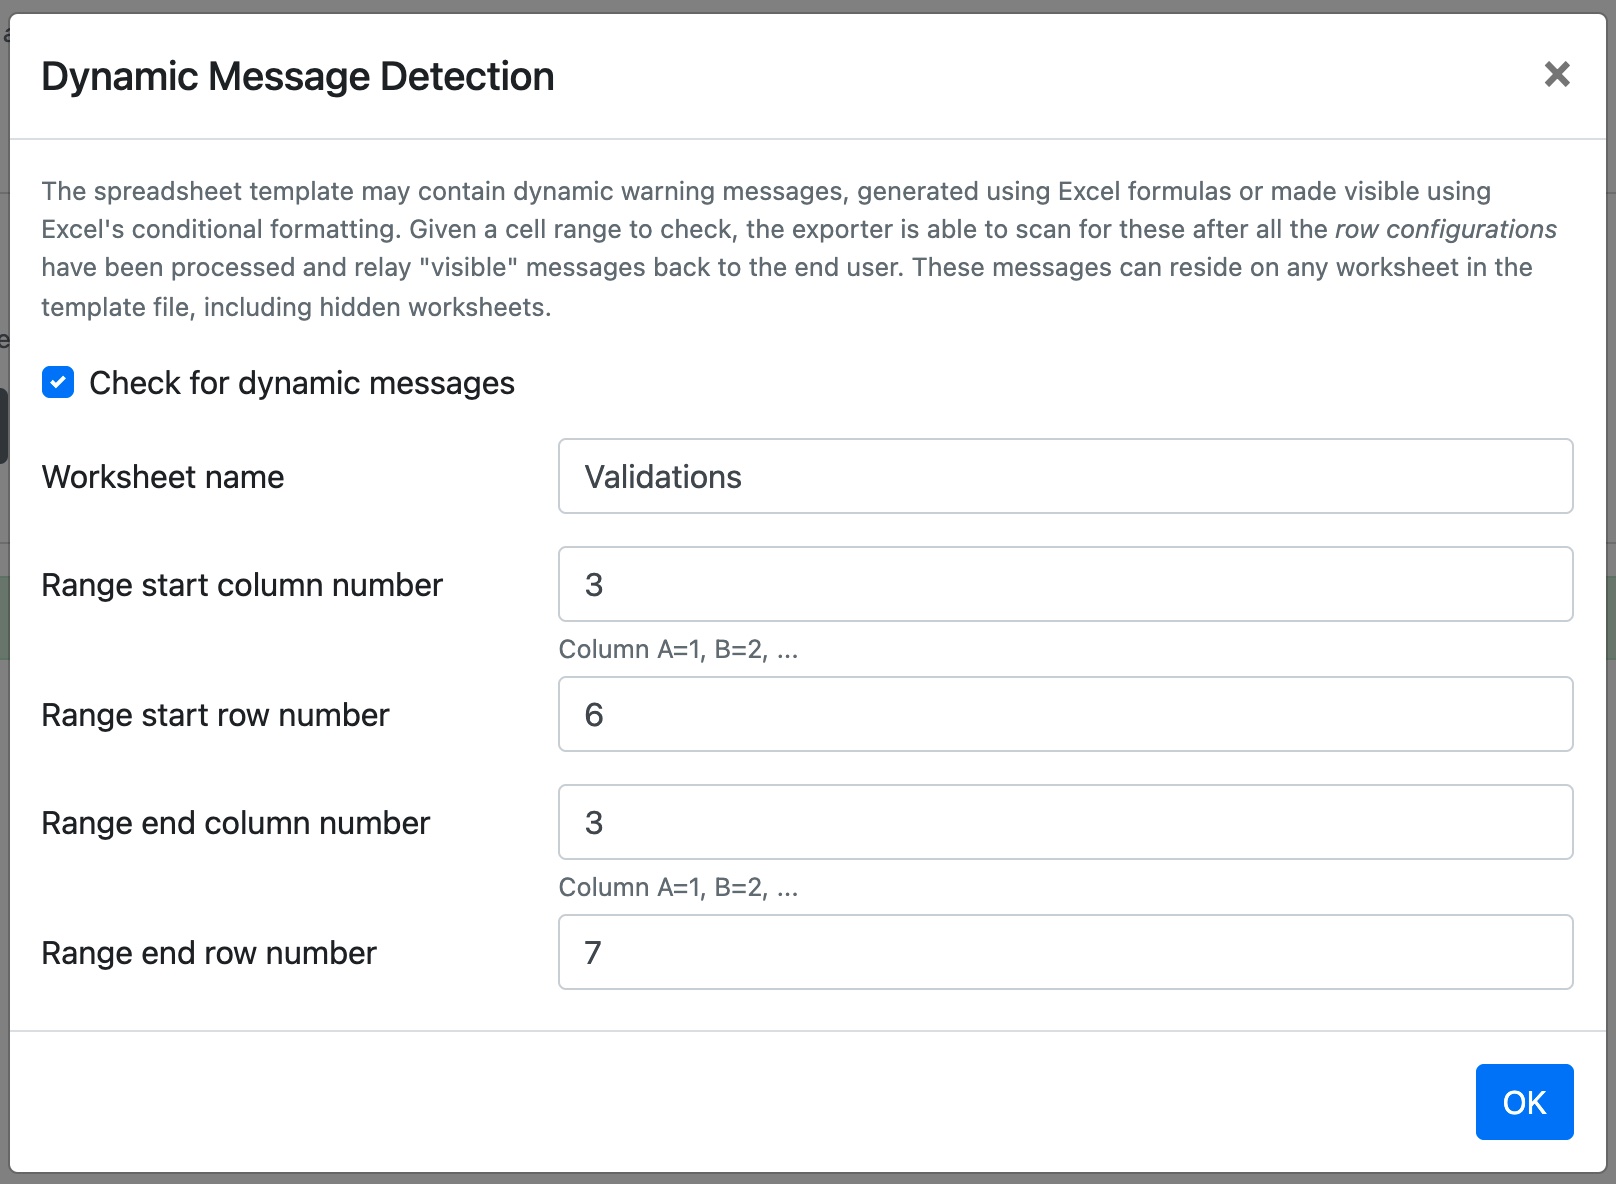
Dynamic Message Detection
Excel spreadsheed may contain dynamic warning messages generated by formulas, condition formatting, etc. Selecting this option opens a dialogue box allowing the user to select a range of cells to check for dynamic messages. Any messages in this cell range are then reported to the user.
Output Worksheet
This option opens a dialogue box allowing the user to select to either have a single worksheet (by entering the name of the required worksheet in the text box) or all the worksheets in the Excel workbook presented as the final report in the FieldTwin tab and Excel export.

Worksheet Configuration
This section allows the user to configure the report worksheets and assign text or data values to the worksheet. The user can add new worksheets and rename each worksheet.
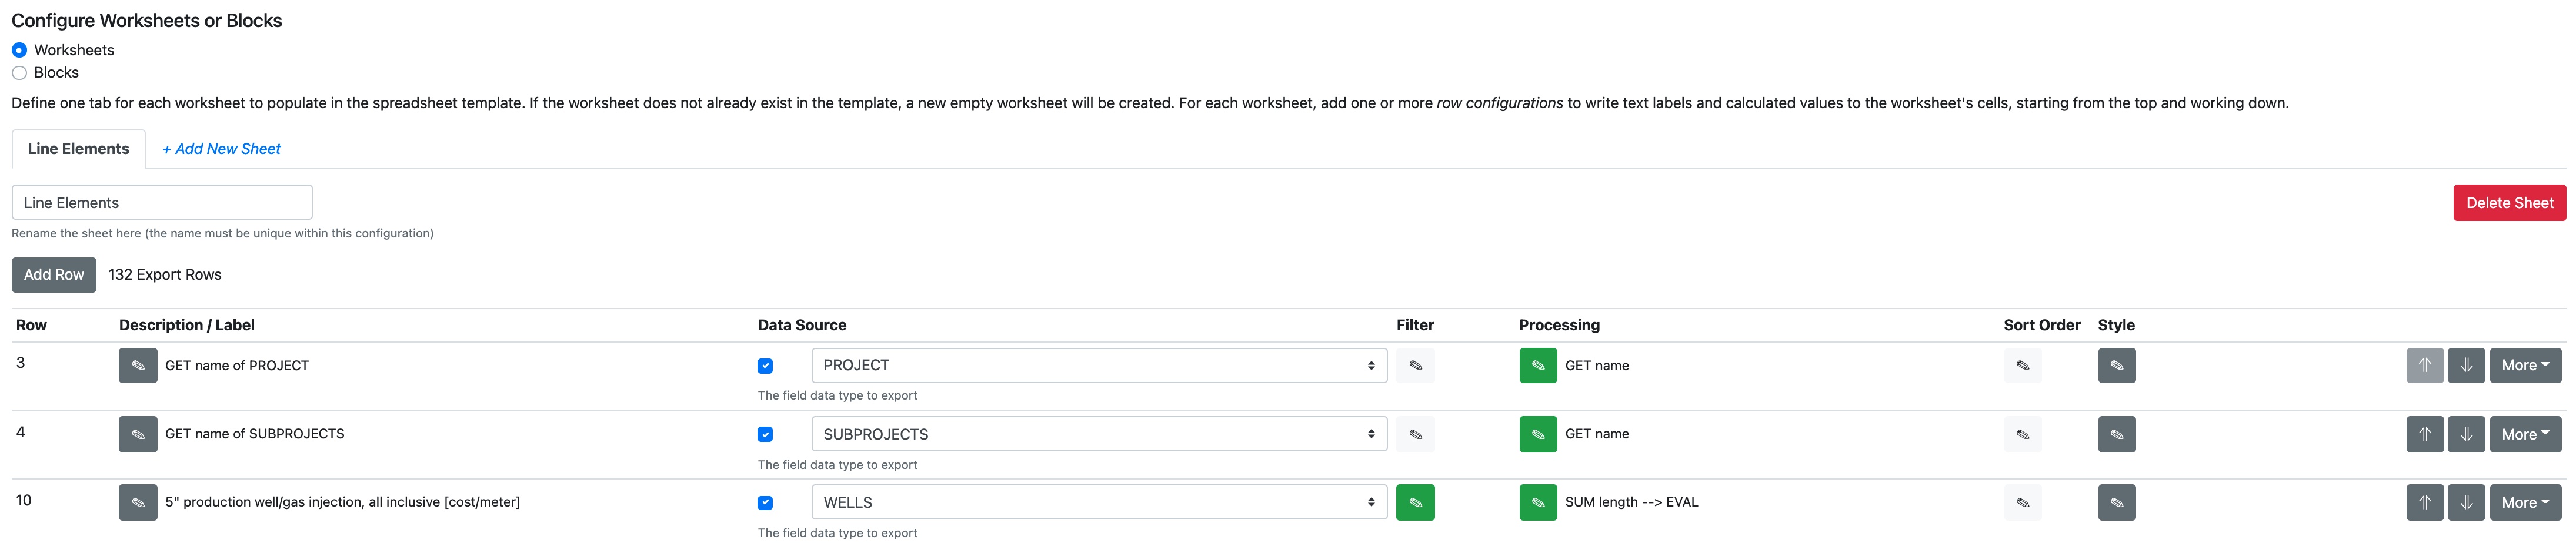
Each row in the table details the text and data values to be placed on each row in the worksheet. The user can modify the configuration for each row to include a text label in a particular cell, the data and data filter to be used and the style (colour, font, etc).
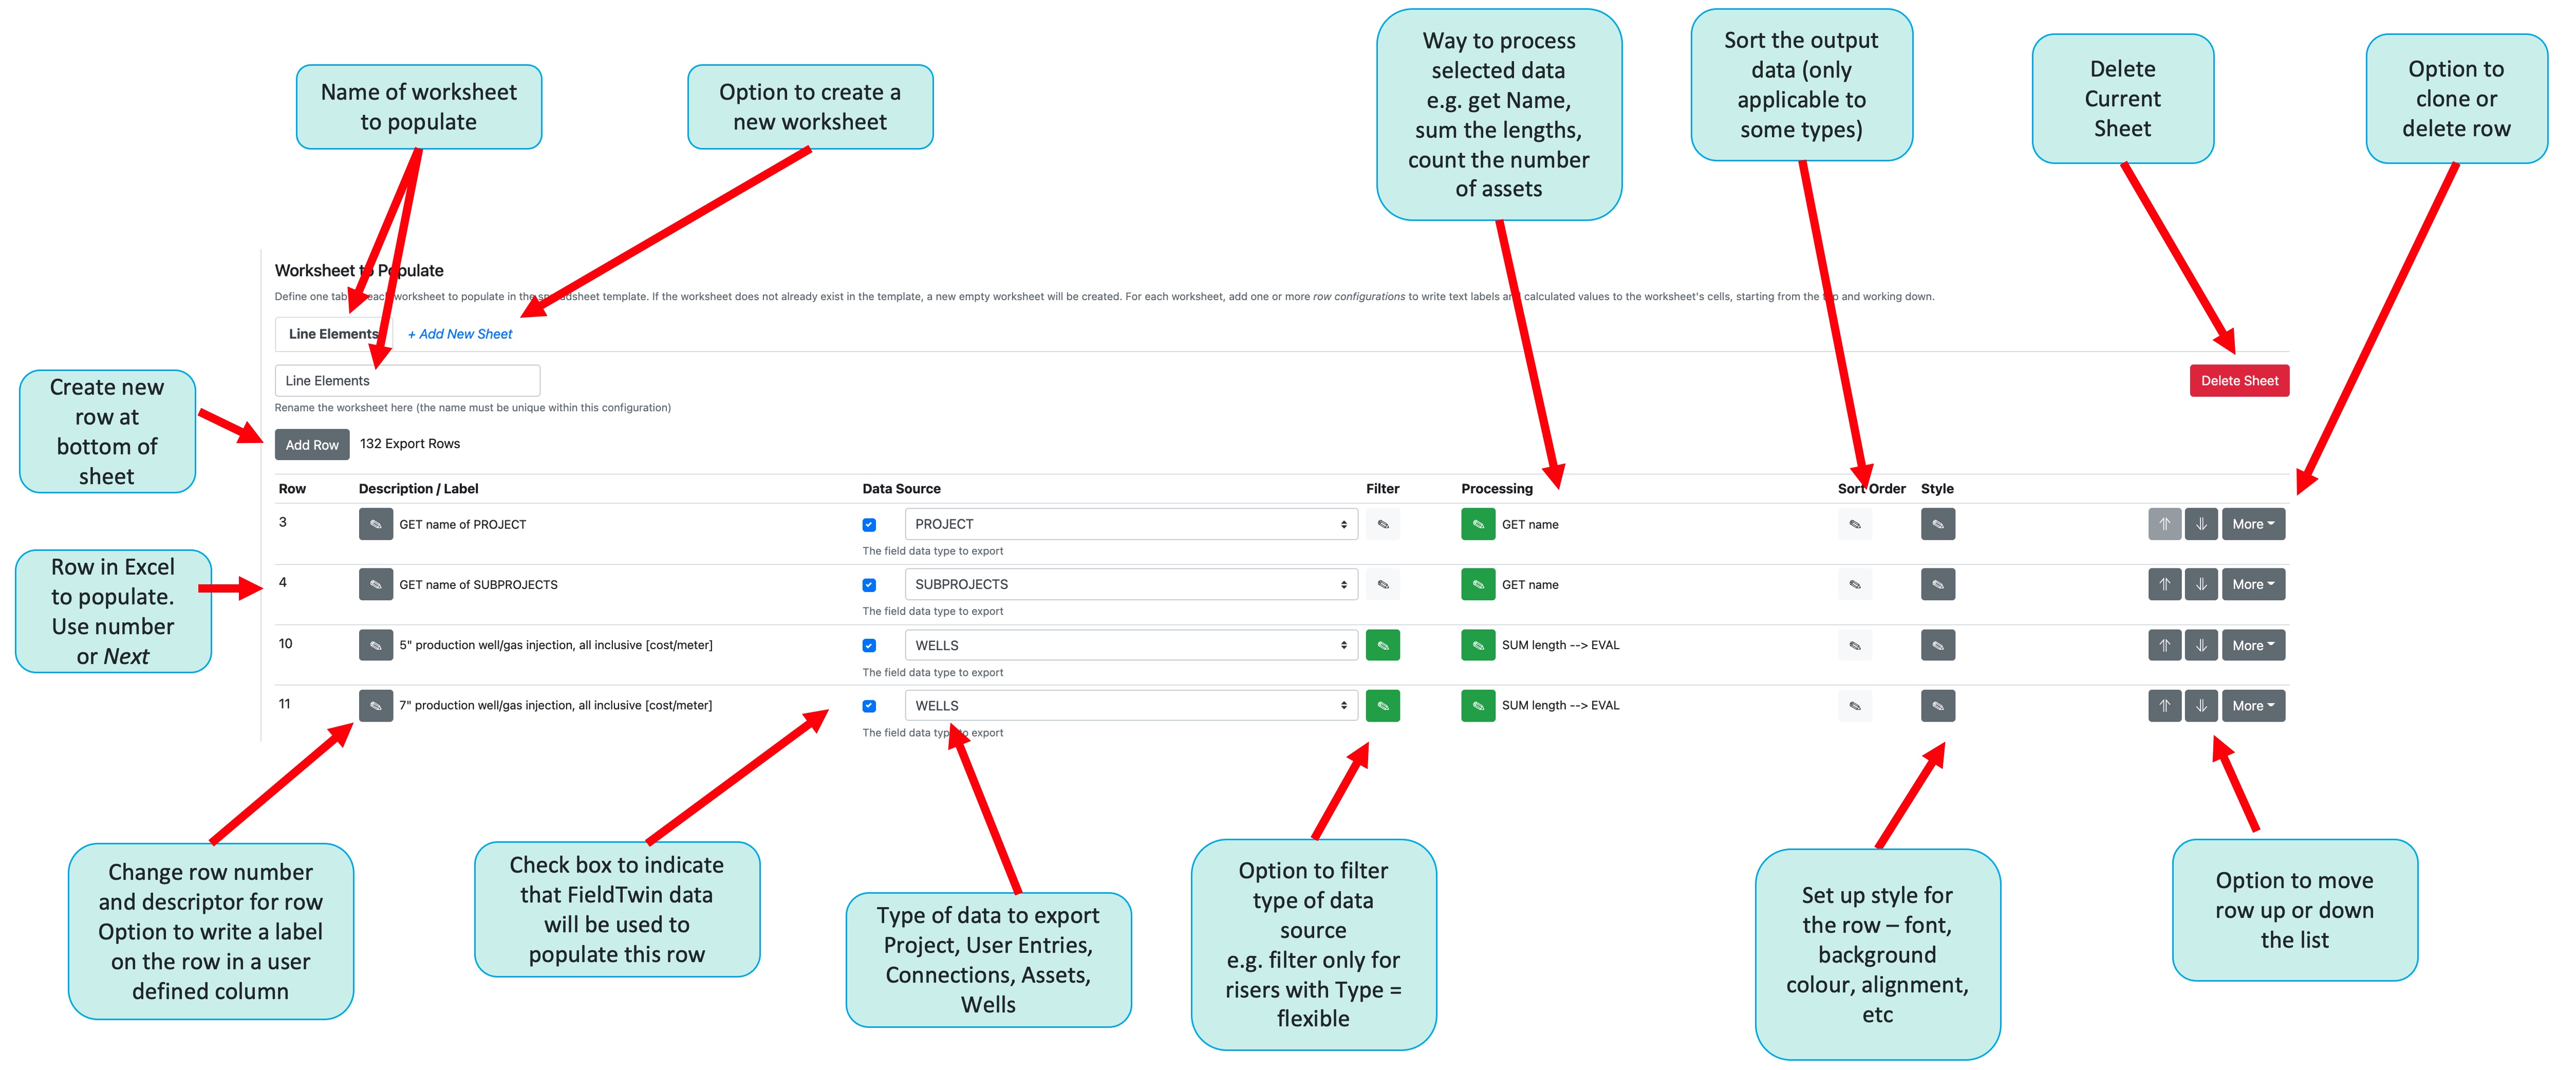
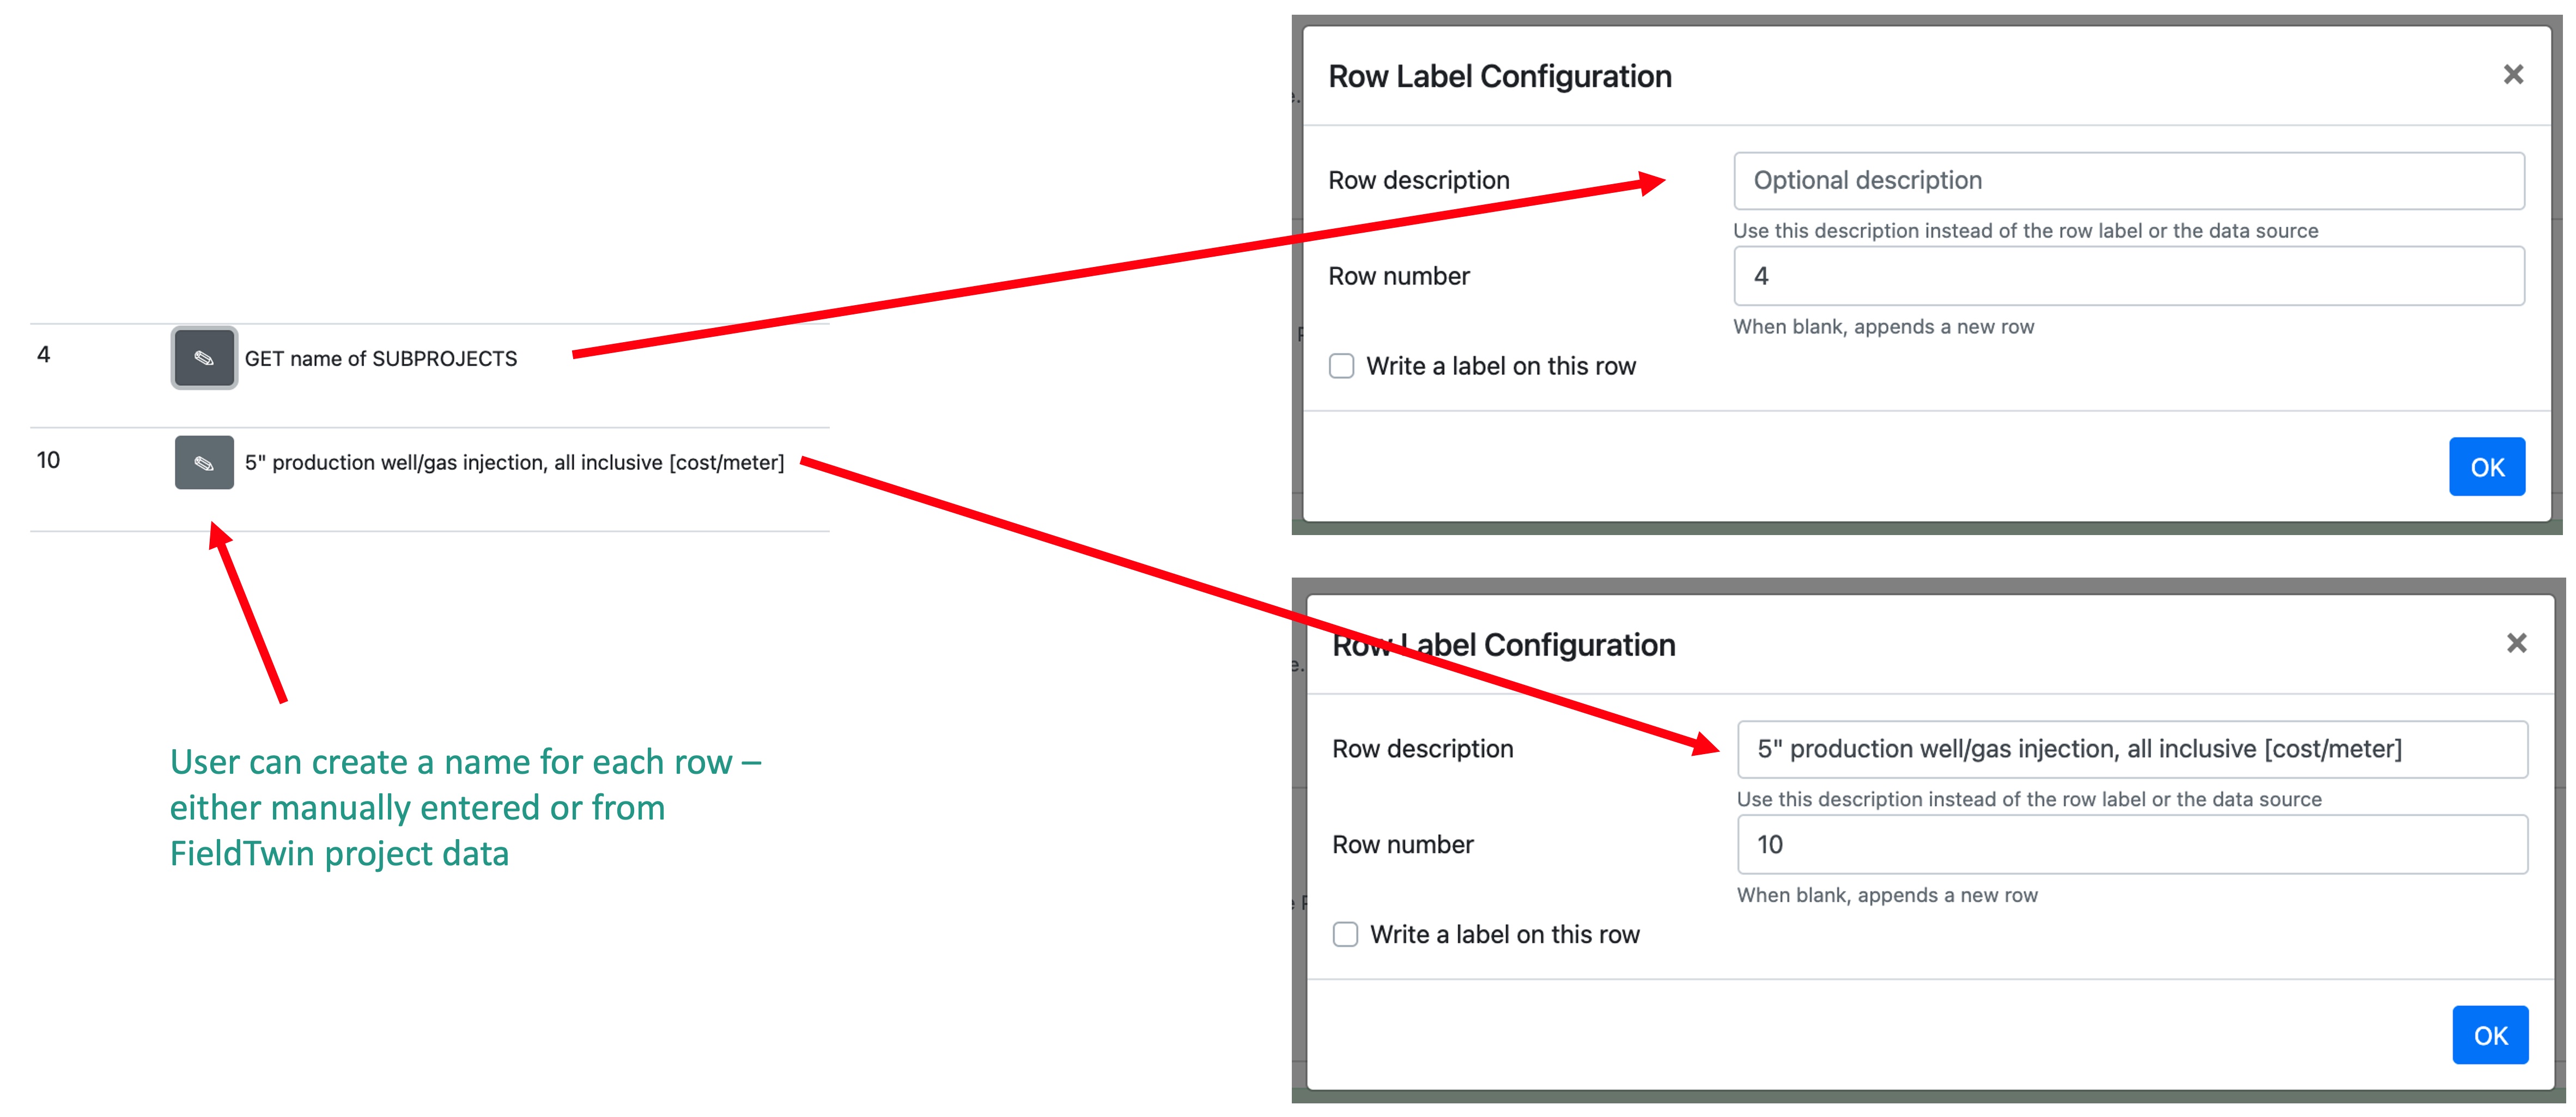
Set Row Number and Description
The first edit button allows the user to change the row description and row number. The user can also select to write a label for the row in the Excel worksheet specifying which column the row label should be placed
If a row number is not specified then the next row in the worksheet following the row number specified in the row above will be selected.
Select Data Source
A data source must be selected for each row using the drop down list indicating which type of data will be used to populate the report.
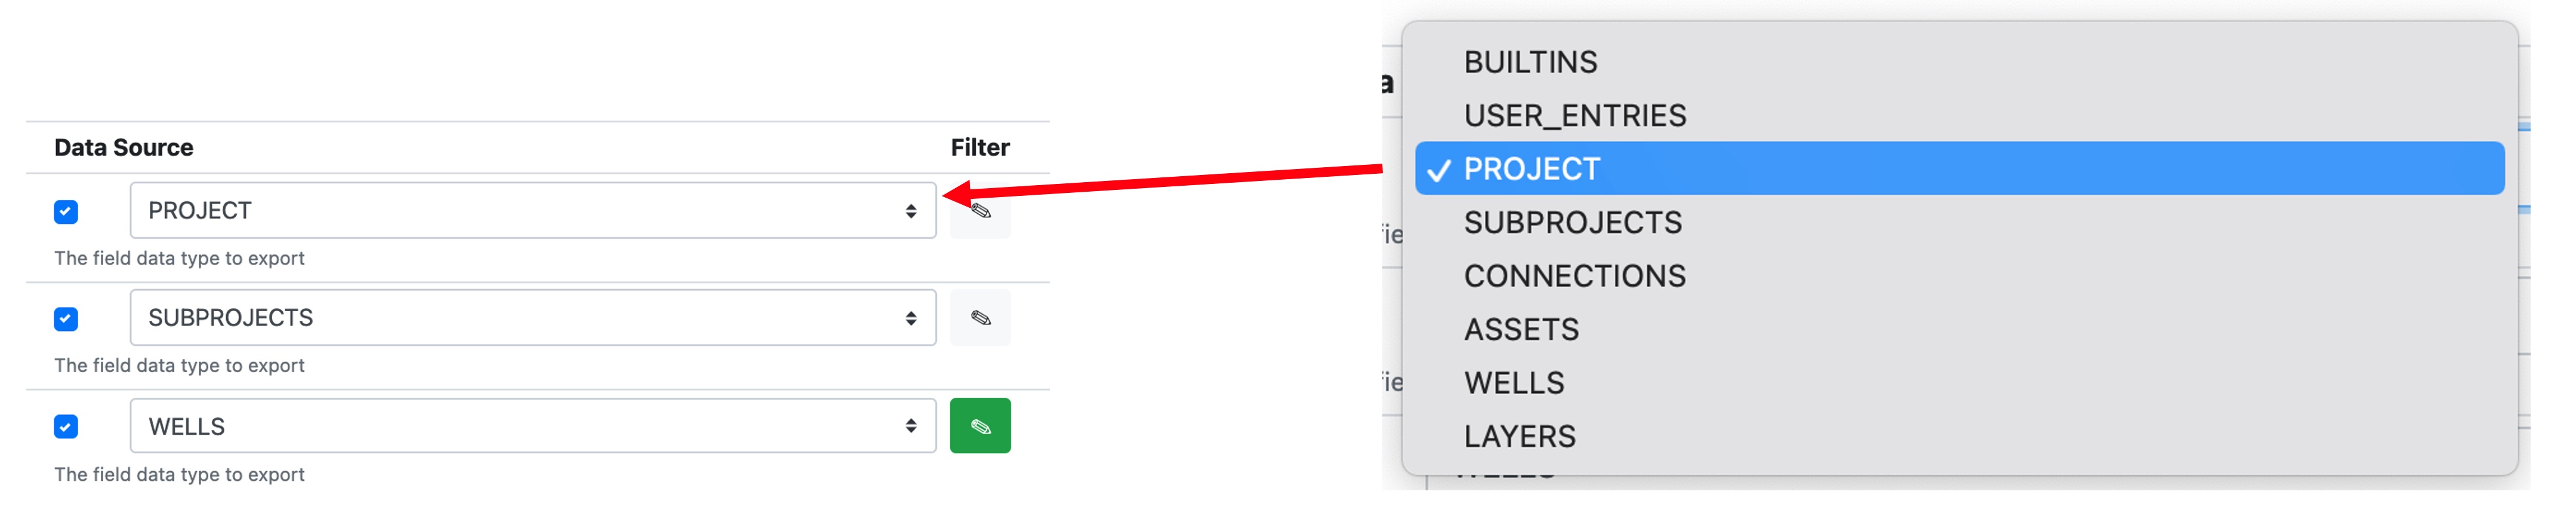
Here the user can select:
| BUILTINS | Account information such as date, time, user email, etc | | USER_ENTRIES | Values from the user created additional data list | | PROJECTS | Project information such as name, location, account, creator, etc | | SUBPROJECTS | Sub-project information such as sub-project name, last update, etc | | CONNECTIONS | Information and metadata relating to specific connections | | ASSETS | Information and metadata relating to specific assets | | WELLS | Information and metadata relating to specific wells | | LAYERS | Information relating to specific layers |
Information on specific connections, assets and wells can be name, label, length, depth, type, etc
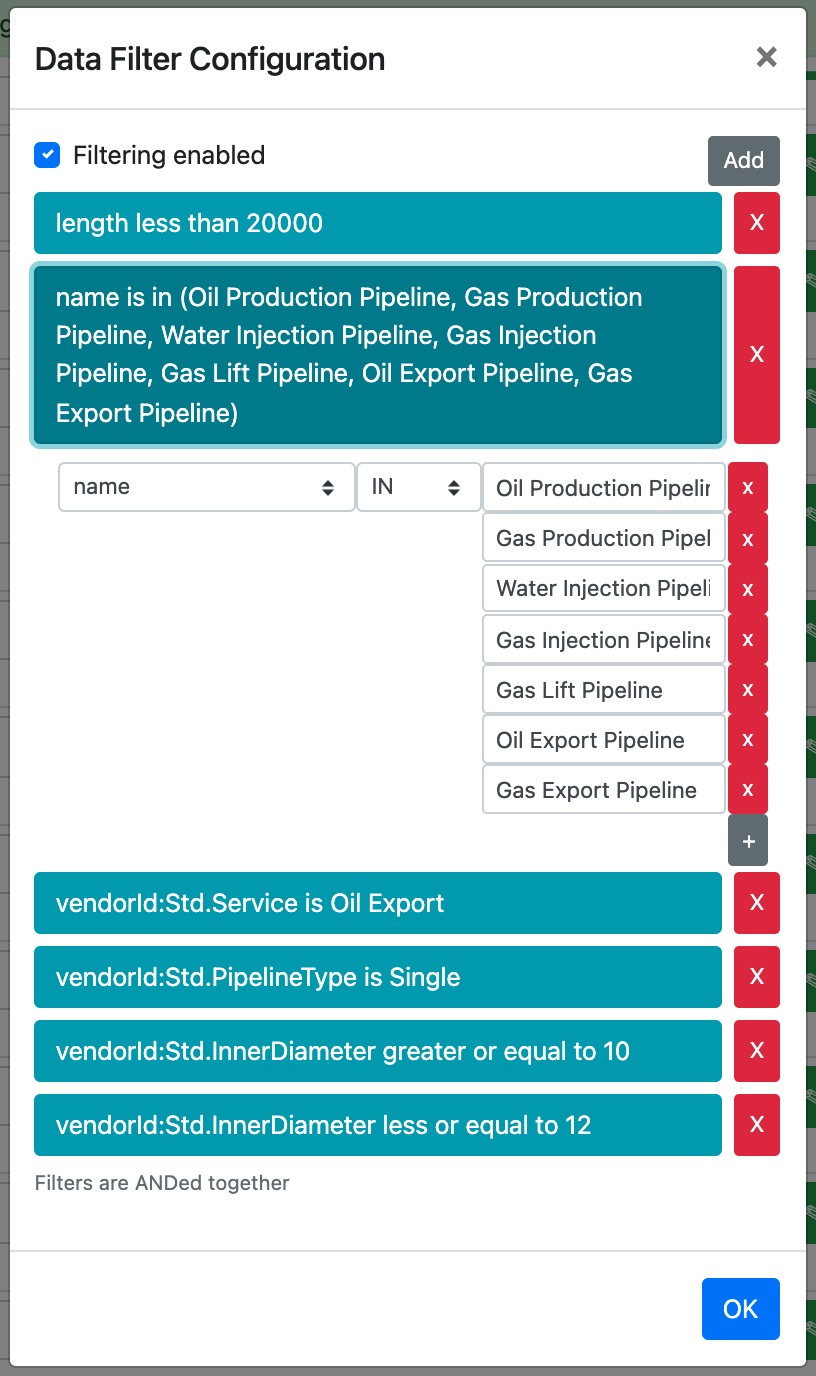
Setup Data Filter
The edit icon to the right of the data source opens a dialog allowing the user to add a filter to the selected data source. The drop down list will display the data values which can be filtered for the selected data source, the operator to use (= < > IN NOTIN, etc) and the condition. Multiple filters may be added and multiple conditions can be used for example .
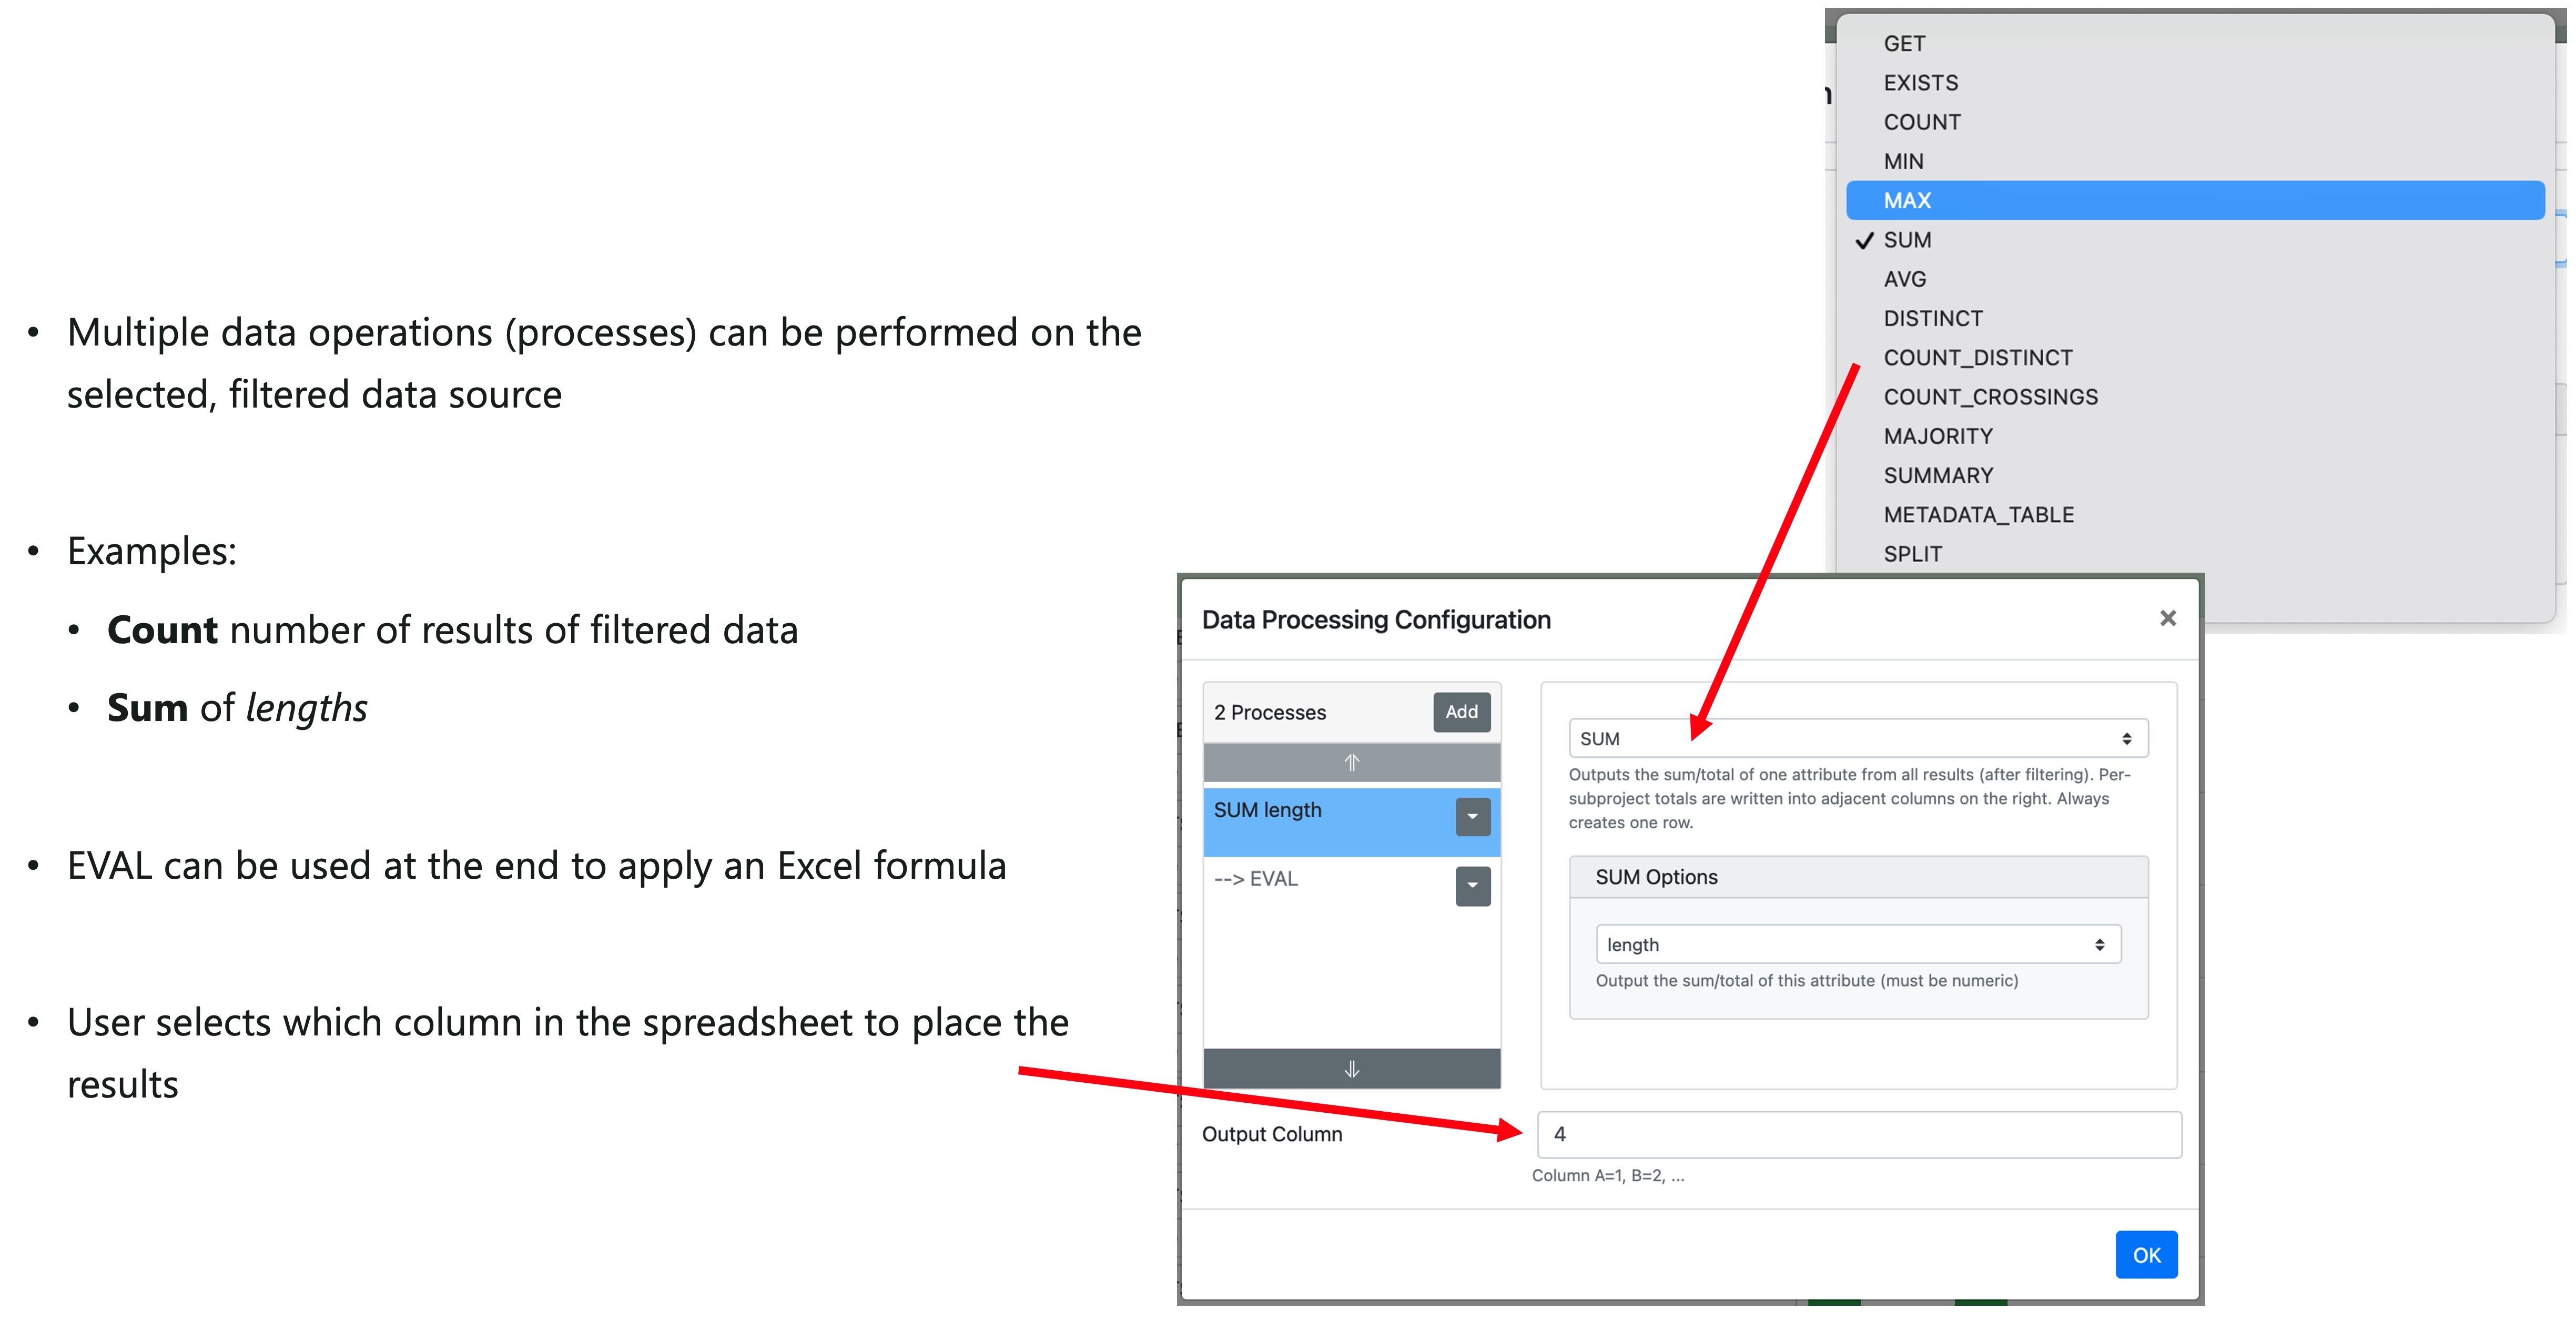
Setup Data Processing Parameters
As shown in the image below, the next edit icon allows the user to perform some data processing on the filtered data. This allows a number of functions to be performed on the data such as a SUM of lengths or other metadata parameters, averaging, check if exists, etc).
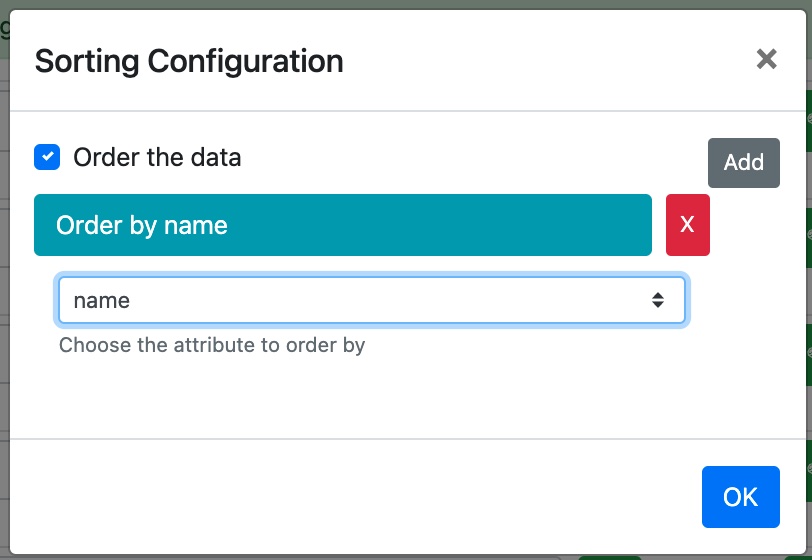
Sort Data
Depending on the selected data source and filter applied, the user has the option to SORT the results of the data processing.
If the data type is not sortable the option will be disabled in the dialog.
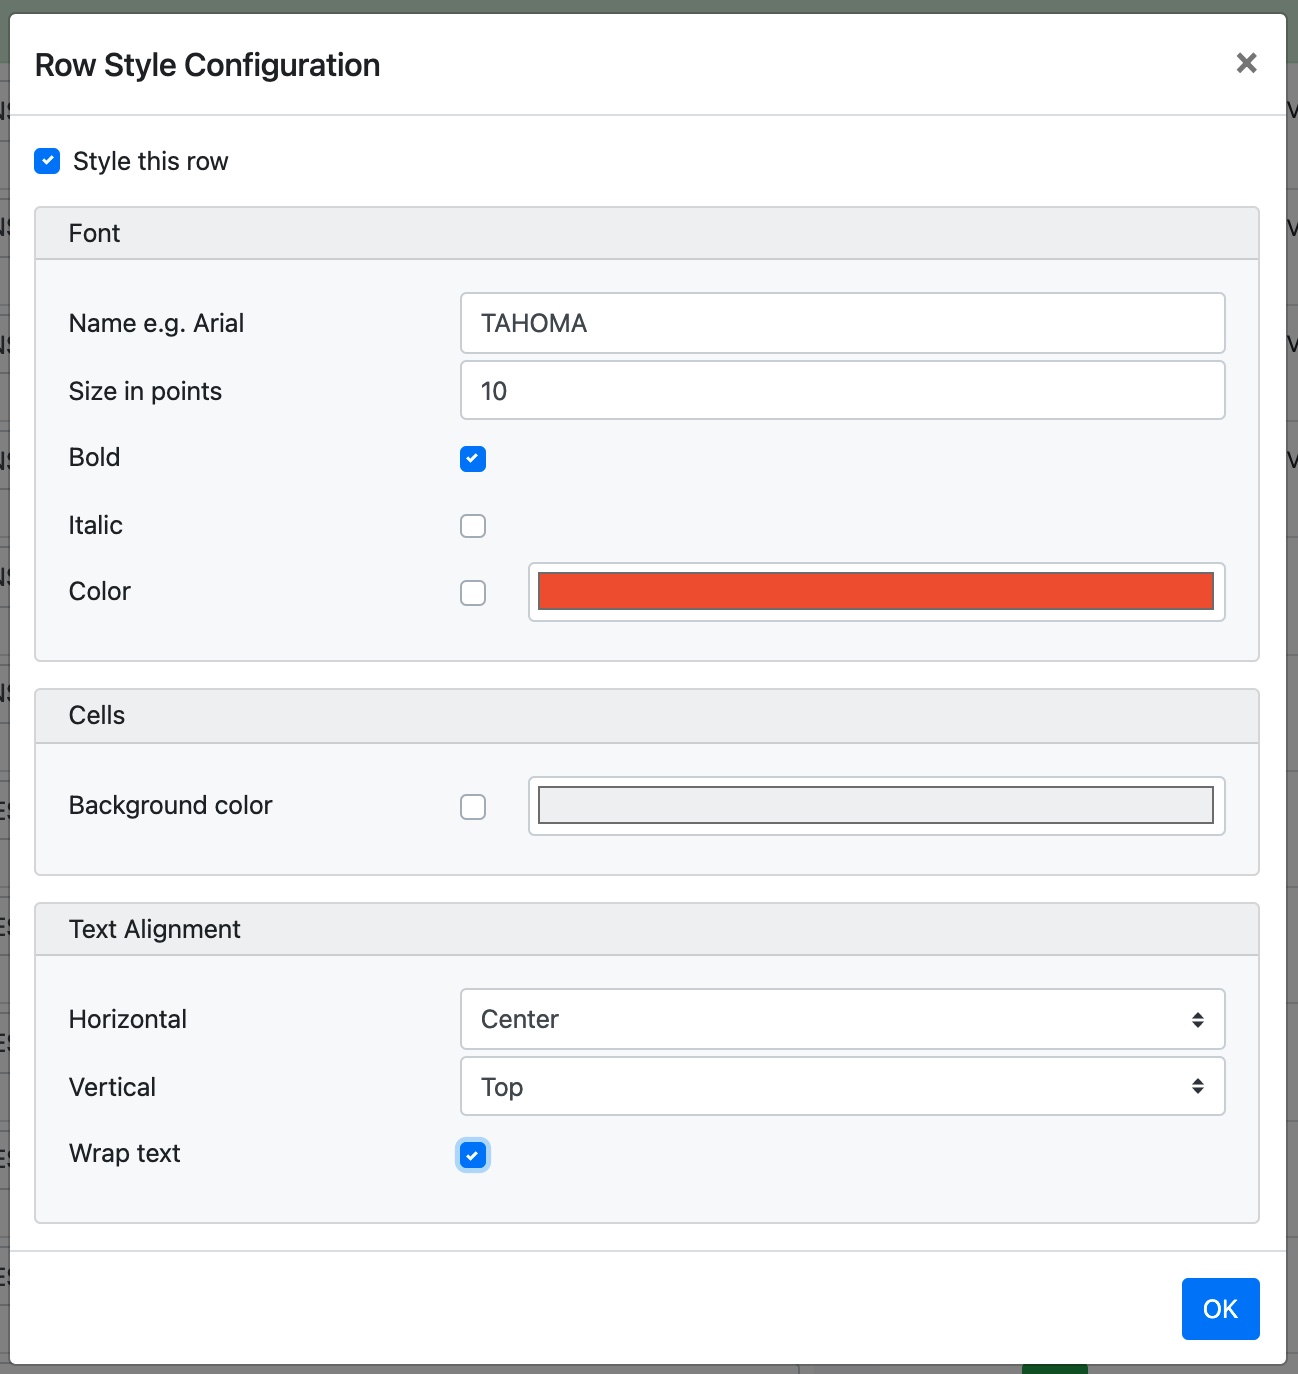
Format Row
The final configuration dialog allows the user to define the style of the row in the Excel worksheet including font type, colour and size, background colour and text alignment.
Organise, Clone and Delete Rows
The buttons on the right of each row allow the user to move the selected row UP or DOWN the row configuration list and also to CLONE or DELETE the current row.
Save Changes
Remember to click the Save Changes button when you have finished editing the profile.
Any problems found will be shown next to the Save button. At this point your changes will not be saved. You can correct the problems and try saving again, or click Save Anyway and return to fix the problems later.
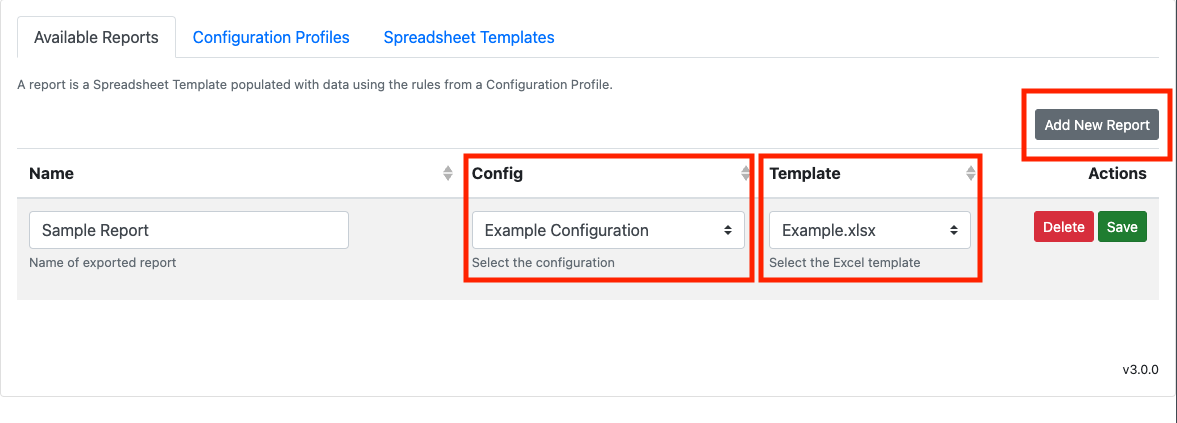
Defining a Report
With a Template and a Configuration Profile in place, return to the 1st tab. Click Add New Report then the Edit button on the newly created report entry.
Enter a name for the report, select the Configuration Profile to use and the Template to populate, then click Save. The report will now be available from the XLSX Costing tab in FieldTwin.