FieldTwin Wind Farm Designer Integration Documentation
Description
Wind Farm Designer is an integration in the FieldTwin platform that provides users with the ability to create wind farms by defining a geographical "lease area" as a boundary and configuring various settings such as turbine, foundation, anchors and mooring line types.
A 2D preview of the wind farm layout is always available, visualizing the user changes in real time. Performing simulation and optimization of the layout using DTU PyWake and TOPFARM allows for seamless calculation of the projected wind farm AEP and cost. Upon completion of a wind farm design, a 3D version of the layout can be recreated in FieldTwin's viewport.
Multiple wind farm configurations can be created per subproject, allowing the users to compare their results side by side.
Installation
In FieldTwin Admin, go to Account Settings, then Integrations, and click Create New Tab. Set the following values:
Name:                           Wind Farm Designer
URL:                            https://wind-utilities-integration-wind-frontenduser.TBD/
Account Settings URL:           https://wind-utilities-integration-wind-frontendadmin.TBD/
Use GET verb:                   yes
Do not pass arguments in URL:   yes
Tab Display Position:           Module Panel (default)
Wind Farm Designer User
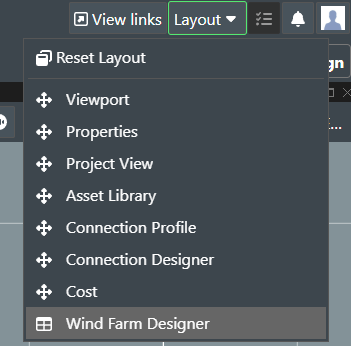
The Wind Farm Designer User integration can be accessed through FieldTwin Designer. To do so, click on "Layout", then "Wind Farm Designer" or however the integration is named in the admin part.
Wind farm list view
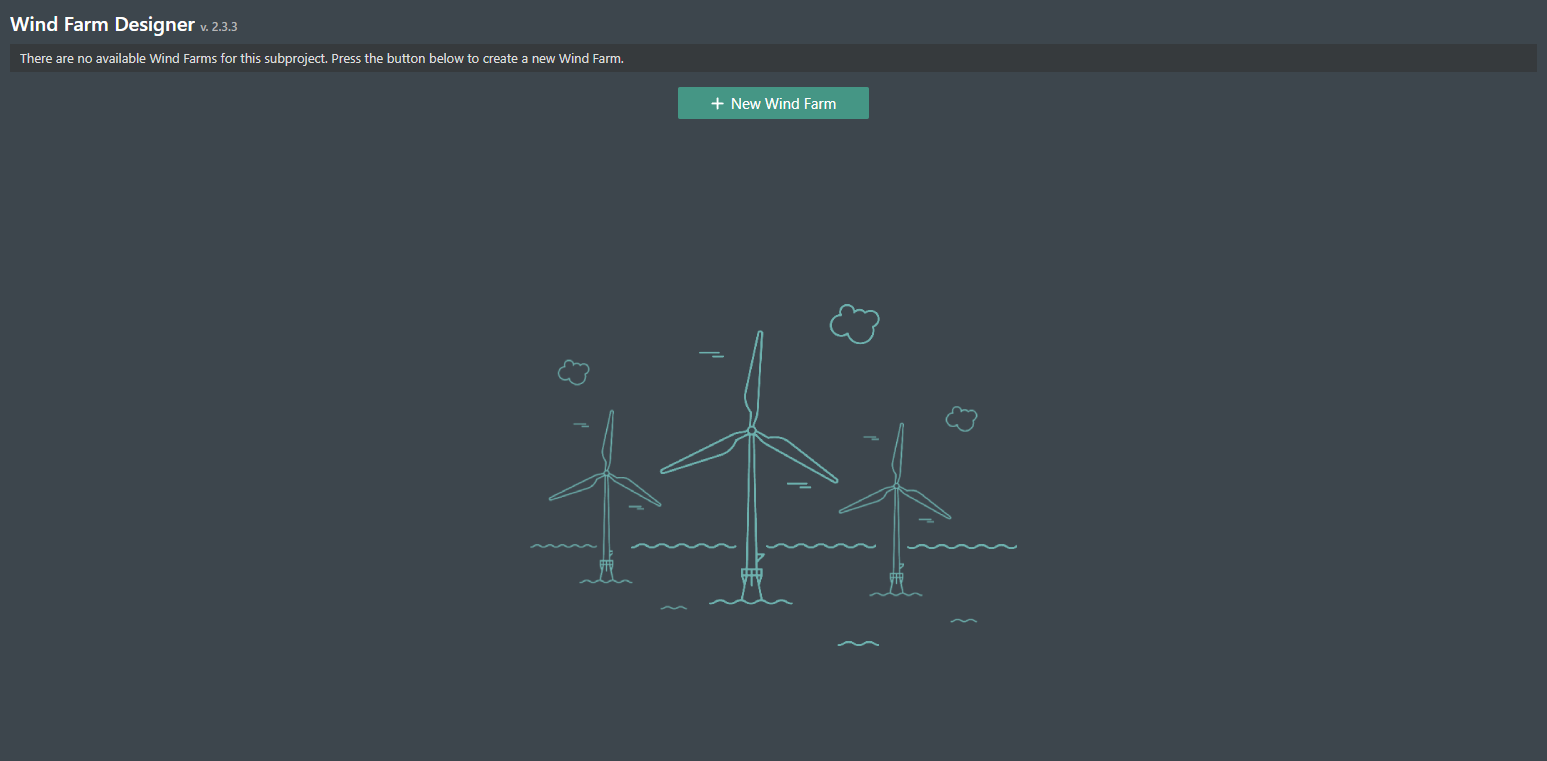
View of Wind Farm Designer when it's first open.
When wind farm configurations are created and saved, they get added to this list.
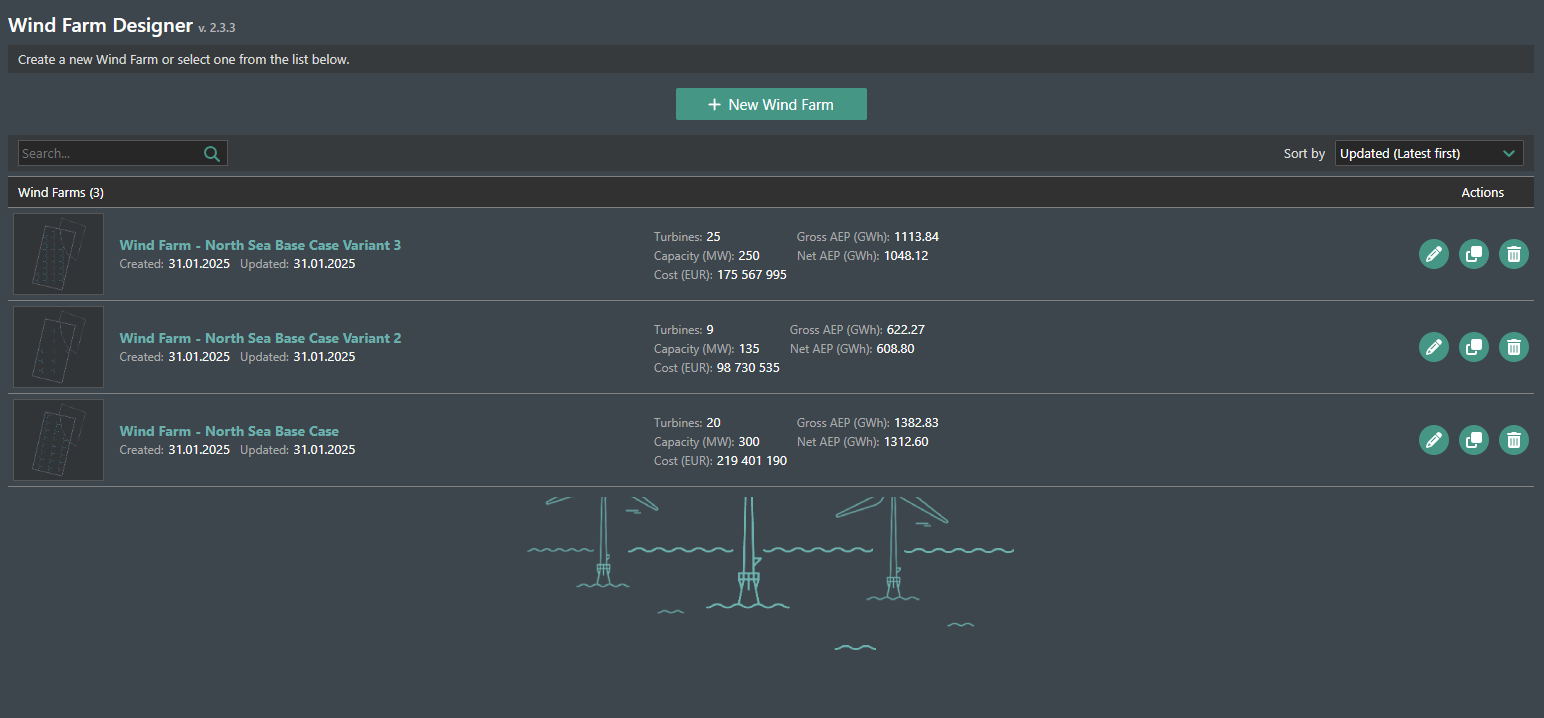
The list can be searched by wind farm name using the search field.
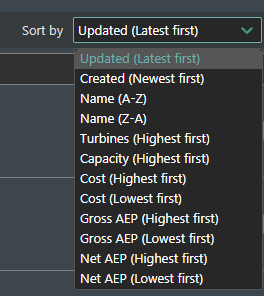
Sorting is available through the "Sort by" field. The default sorting is by "Updated (Latest first)".
Each wind farm row contains information about when it was "Created" and "Updated", also its "Turbines", "Capacity (MW)", "Cost (EUR)", "Gross AEP (GWh)", "Net AEP (GWh)". Clicking on the row opens the selected wind farm configuration for further inspection or adjustments.
The available actions are:
 rename the wind farm.
 clone the wind farm.
 delete the wind farm.
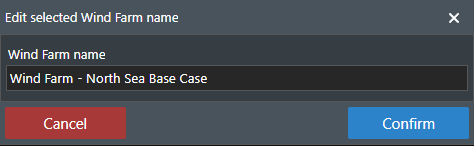
Clicking on the rename button opens a popup, where the new name can be set.
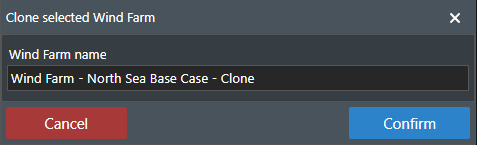
Clicking on the clone wind farm button opens a popup, prompting for a name for the cloned wind farm.
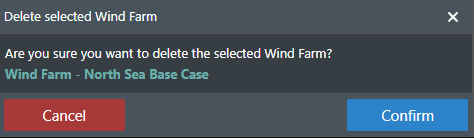
Clicking on the delete button opens a confirmation popup.
Create new wind farm
To create a new wind farm, click on the New Wind Farm button.

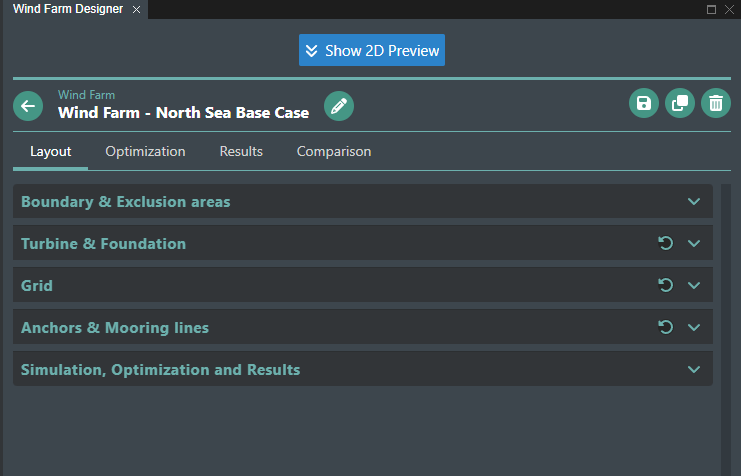
A new view will appear.
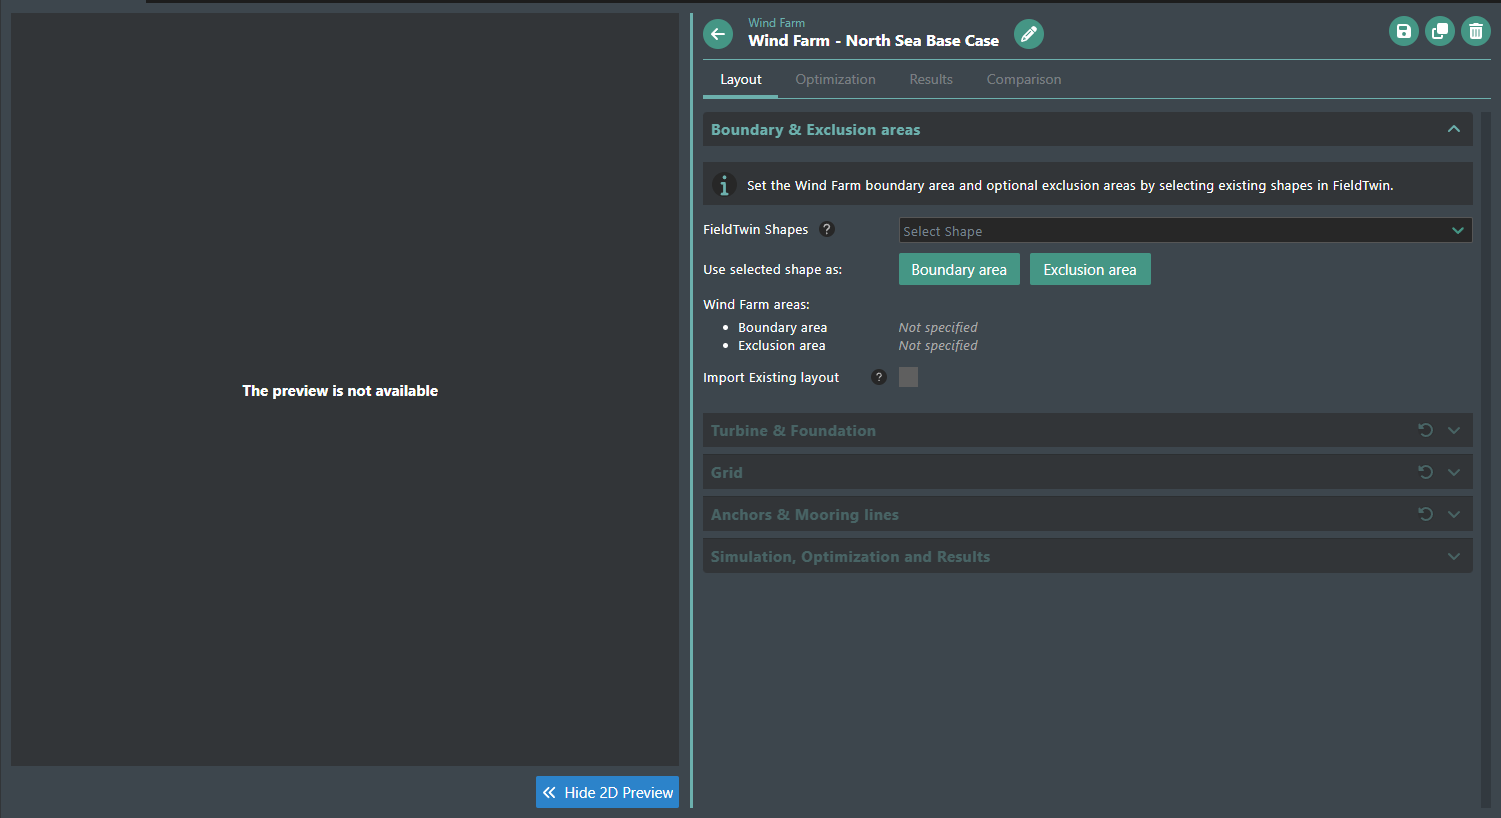
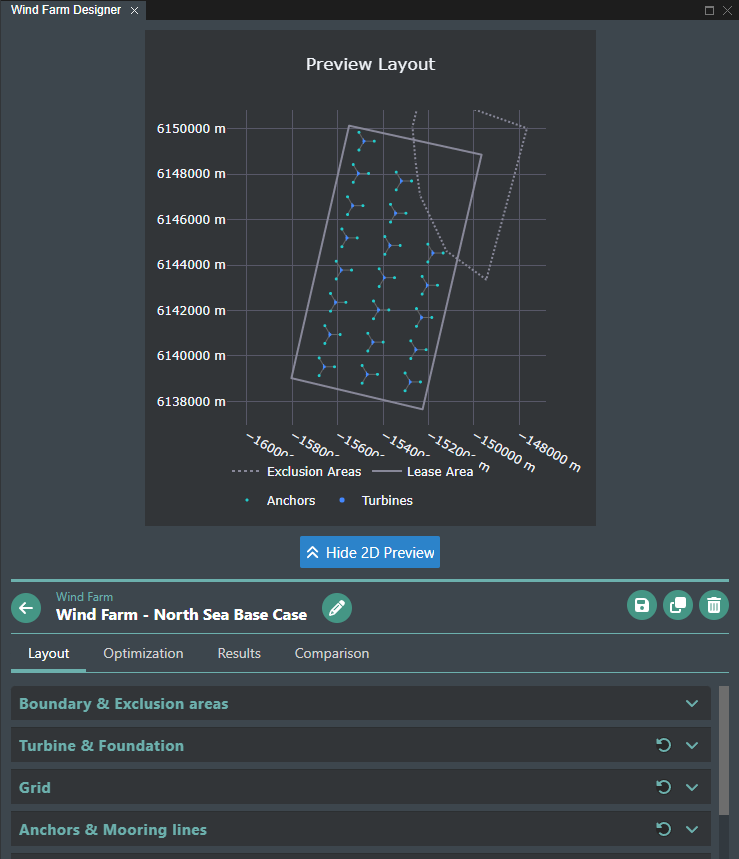
On the left side is the 2D Preview Layout, which represents the wind farm and is updated once a boundary area is selected, and on any layout changes. The right side contains the Wind Farm Header and multiple tabs, separating the main four subpages, namely Layout, Optimization, Results and Comparison.
Wind Farm Header
The wind farm header provides management options for the current wind farm.

 go back to the wind farm list.
- rename the wind farm.
 save the wind farm.
- clone the wind farm.
- delete the wind farm.
Saving the current wind farm ensures that all of the current wind farm settings will be kept in the database.
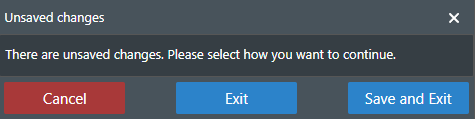
Clicking on the back icon, while there are unsaved changes in the current wind farm shows a warning popup with the ability to "Cancel", "Exit" without saving and "Save and Exit".
Layout tab
The layout tab contains five sections of configuration options:
- Boundary & Exclusion areas
- Turbine & Foundation
- Grid
- Anchors & Mooring lines
- Simulation, Optimization and Results
Boundary & Exclusion areas
By default, when creating a new wind farm, only the "Boundary & Exclusion areas" section is allowed.
To begin, select a boundary area by choosing one of the existing FieldTwin's shapes.

Then, click on the Boundary area button. The same process can be used to set one or many exclusion areas for the wind farm, where the wind assets won't be allowed. To do so, select the desired shape and click Exclusion area.

Upon setting the boundary area, the wind farm will be generated with default values and all configuration sections will be unlocked, allowing them to be opened or closed on click.
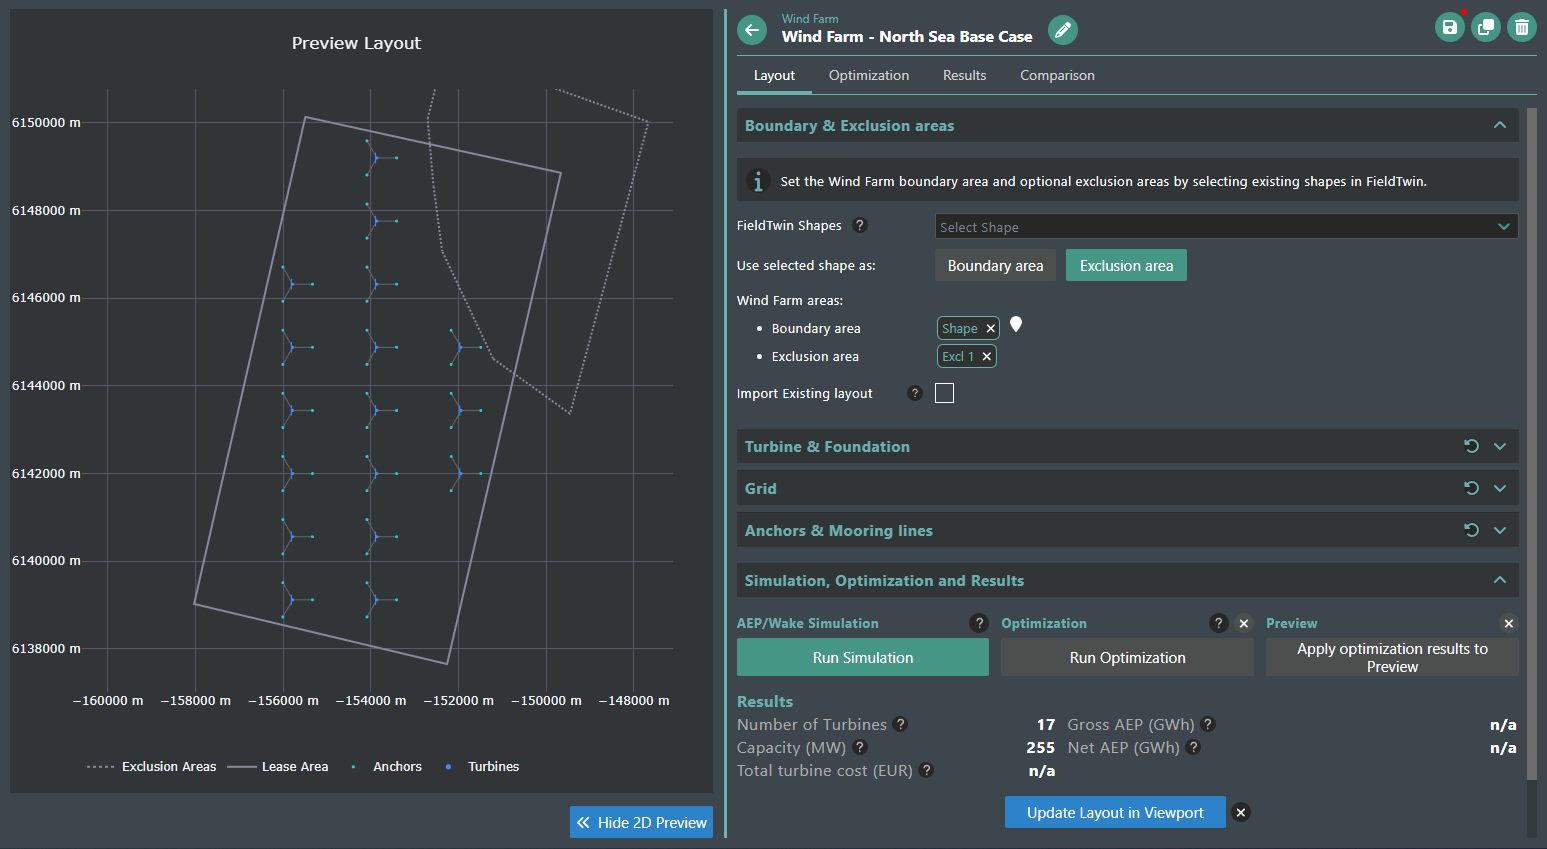
The wind farm boundary and exclusion areas will be listed.
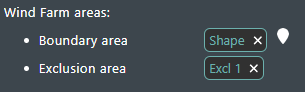
It's possible to remove them by clicking on the X icon next to the area's name. Next to the boundary area is an icon, which locates the shape in FieldTwin's viewport.
![]()
If there is an already existing 3D layout of the farm in FieldTwin, the Import Existing layout checkbox can be used to automatically import the turbines, anchors and mooring lines and prefill the settings.
Upon checking it, the existing wind farm will be imported and a text indicating the number of successfully imported assets will be displayed next to the checkbox.

Preview Layout
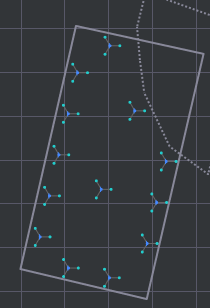
The preview layout visualizes a 2D representation of the current wind farm. Any settings that are made to the configuration will be applied in real-time.
The preview includes the lease area, exclusion areas, turbines, anchors and mooring lines.
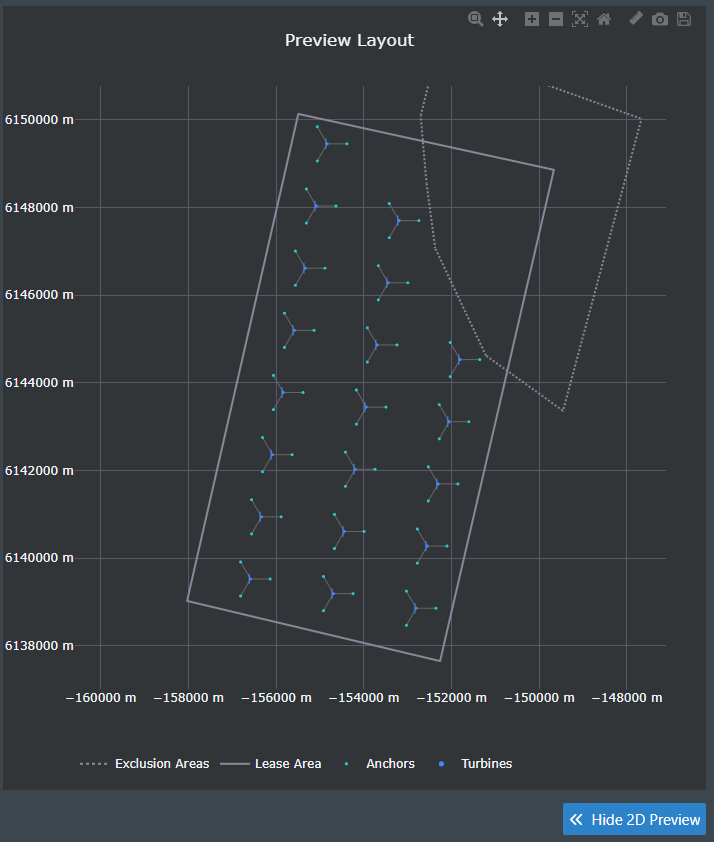
The following tools are available within:
 enable zoom tool.
 enable pan tool.
 zoom in.
 zoom out.
 autoscale.
 reset axes.
 enable / disable ruler tool.
 download preview as PNG.
 download preview as SVG.
Measuring distance between turbines and/or anchors can be done with the ruler tool. It can be enabled through the ruler icon from the preview top menu.
After the ruler tool has been enabled, clicking on a turbine or an anchor selects it as measurement starting point. Then, clicking on another turbine or anchor marks the second point. A red line is drawn between them and the distance is displayed.
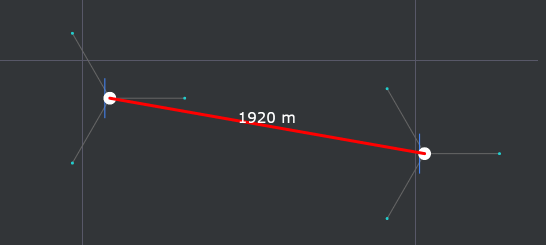
Clicking on third turbine or anchor measures the distance between it and the first selected asset. The first point can be reset by selecting it again. To exit the measurement mode, click on the ruler tool icon again.
The preview can be hidden, leaving a larger space for the configuration settings by clicking on the "Hide 2D Preview" button.

Depending on the integration window's width, the preview gets positioned differently. If the width is smaller, it will get placed on top of the configuration settings, otherwise they will be shown side by side.
Clicking on the "Show 2D Preview" button or dragging the green separator line will enable the preview again.
Turbine & Foundation
Clicking on the Turbine & Foundation section opens this view.
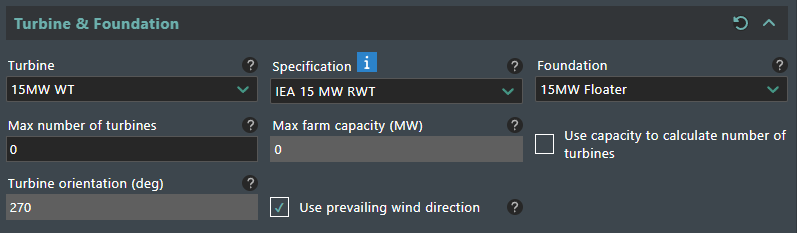
The Turbine & Foundation section contains the following settings:
- Turbine - allows for setting the turbine asset type. Choosing a smaller turbine type increases the total number of turbines, which can be used in the wind farm layout.
- Specification - allows for setting turbine asset specification type, which can be predefined from the Admin part of the integration.
- Foundation - allows for setting the foundation asset type. The options depend on the chosen turbine asset type.
- Max number of turbines - allows for setting a limit for a maximum number of turbines in the wind farm.
- Max farm capacity (MW) - allows for setting the farm's maximum capacity in MW, which will limit the allowed number of turbines.
- Use capacity to calculate number of turbines - allows for choosing whether to use "Max number of turbines" or "Max farm capacity (MW)" setting.
- Turbine orientation (deg) - allows for setting the turbine's orientation. The turbines will be aligned to face this orientation.
- Use prevailing wind direction - allows to use the prevailing wind direction for turbine orientation instead of manually specifying it though the "Turbine orientation (deg)" setting.
Depending on the chosen boundary area, if the depth is beyond a certain threshold, a floating foundation will be preselected. This threshold can be set from the Admin part of the integration.
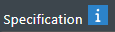
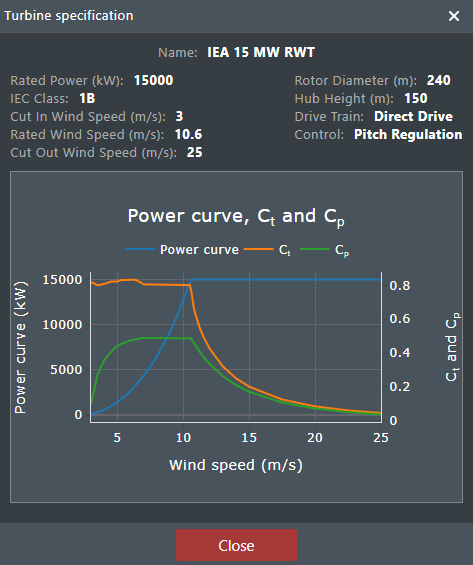
The chosen specification can be inspected by clicking on the blue info icon.
It opens a popup with detailed information and graph of the current specification.
There is a possibility of resetting all Turbine & Foundation settings by clicking on the reset icon in the top right corner of the section.
![]()
Upon clicking it, a confirmation popup will be shown, allowing to "Confirm" or "Cancel" the reset.
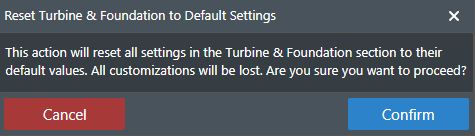
Similar reset functionality is available for all sections that provide user input in the "Layout" and "Optimization" tabs.
Grid
Clicking on the Grid section opens this view.
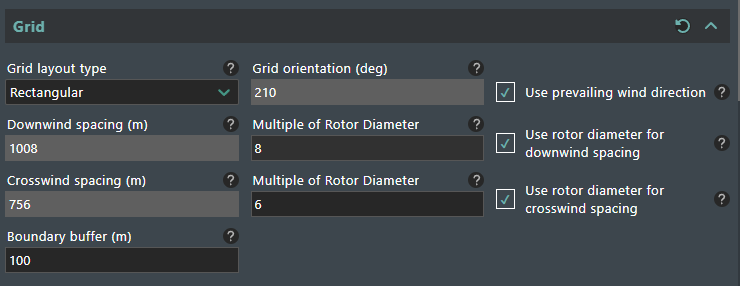
The Grid section contains the following settings:
- Grid layout type - allows for setting the grid layout by choosing "Rectangular", "Triangular" or "Radial" type, which positions the wind turbines differently.
- Grid orientation (deg) - allows for setting the orientation for the whole layout grid. The wind farm will be aligned to this orientation.
- Use prevailing wind direction - allows to use the prevailing wind direction for setting the grid orientation instead of manually specifying it in the "Grid orientation (deg)" field.
- Downwind spacing (m) - allows for setting the downwind spacing, which sets the spacing of turbines in the direction inline with the prevailing wind direction.
- Multiple of Rotor Diameter - allows for setting a multiple of the turbine rotor diameter to use for downwind spacing.
- Use rotor diameter for downwind spacing - allows for choosing whether to use the "Downwind spacing (m)" or "Multiple of Rotor Diameter" settings for the downwind spacing.
- Crosswind spacing (m) - allows for setting the crosswind spacing, which applies a spacing between the turbines perpendicular to the prevailing wind direction.
- Multiple of Rotor Diameter - allows for setting a multiple of the turbine rotor diameter to use for crosswind spacing.
- Use rotor diameter for crosswind spacing - allows for choosing whether to use the "Crosswind spacing (m)" or "Multiple of Rotor Diameter" settings for the crosswind spacing.
- Boundary buffer (m) - allows for setting the minimum distance in meters that will be kept between the wind assets and the boundary areas (lease and exclusion areas).
Example of the different Grid layout types. Rectangular, Triangular, Radial
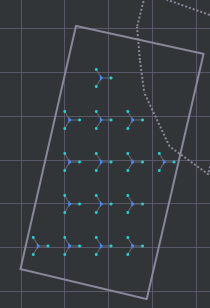
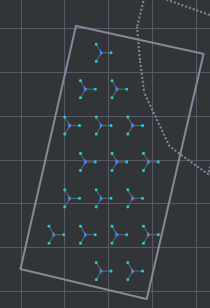
Increasing the spacing between the wind turbines may reduce the total turbine number.
Anchors & Mooring lines
Clicking on the Anchors & Mooring lines section opens this view.
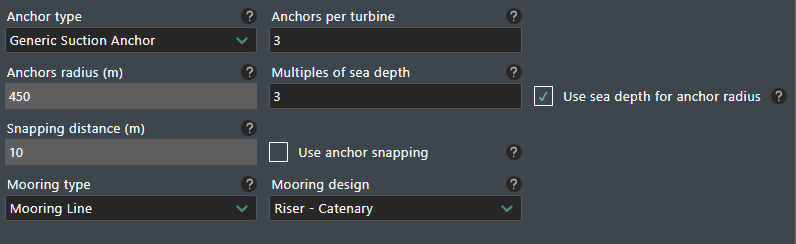
The Anchors & Mooring lines section contains the following settings:
- Anchor type - allows for setting the anchor asset type.
- Anchors per turbine - allows for setting which number of anchors to to use per turbine.
- Anchor radius (m) - allows for setting a distance in meters, at which the anchors will be placed from the turbine center.
- Multiples of sea depth - allows for setting a multiple of sea depth to use for the anchor radius.
- Use sea depth for anchor radius - allows for choosing whether to use "Anchor radius (m)" or "Multiples of sea depth" settings for the anchor radius.
- Snapping distance (m) - allows for setting a distance at which anchors will snap to each other, reducing the total required anchors.
- Use anchor snapping - allows for choosing whether to use anchor snapping or not.
- Mooring type - allows for setting the mooring asset type. Mooring lines connect the turbine to its anchors.
- Mooring design - allows for setting the mooring design. (e.g. Riser - Catenary, Riser - Lazy Wave).
Simulation, Optimization and Results
The Simulation, Optimization and Results section contains this view.
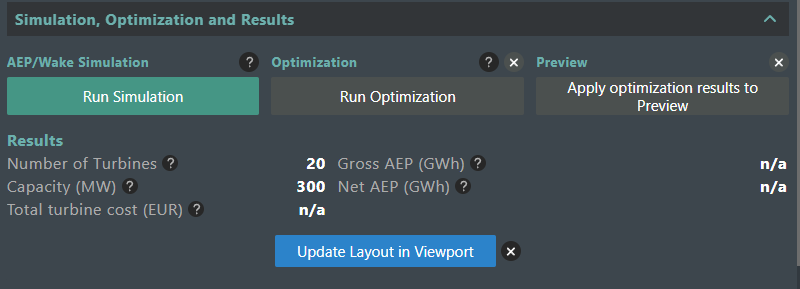
The "Run Simulation" button triggers a simulation of the current wind farm configuration, using the selected settings from the "Simulation Settings" in the "Optimization" tab. The simulation might take a few seconds to complete, then the "Results" sub-section will be filled, providing the "Gros AEP (GWh)", "Net AEP (GWh)" and "Total turbine cost (EUR)".
The "Run Optimization" button can be used to trigger an optimization of the wind farm layout, which should provide better positions for the turbine in order to optimize the AEP.
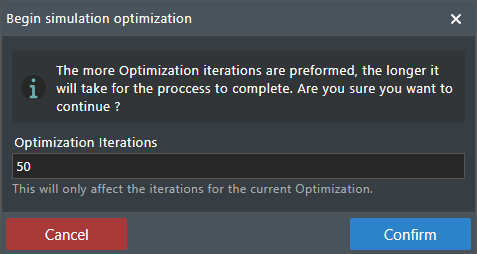
Note, that an optimization is only possible if a simulation was already ran. If a high number of iterations is set in the "Optimization settings" tab and section, a popup will be shown, warning that the process might take a long time to complete, and allows the optimization iterations to be changed.
Completing a successful optimization provides a set of optimized results.
And new proposed positions in the 2D Preview Layout. Using the "Apply optimization results to Preview" button moves the current turbines to their optimized positions.
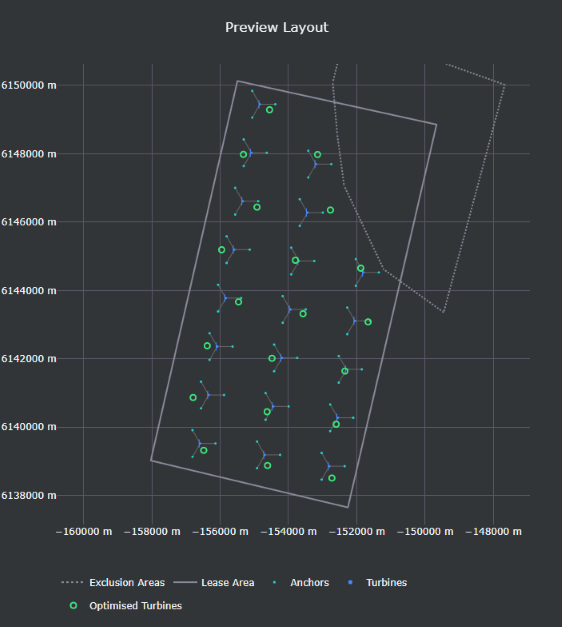
The turbines can be returned back to their original positions by clicking on the X icon next to the "Apply optimization results to Preview" button.
![]()
A similar icon is found next to the "Run Optimization" button, which clears all optimization results.
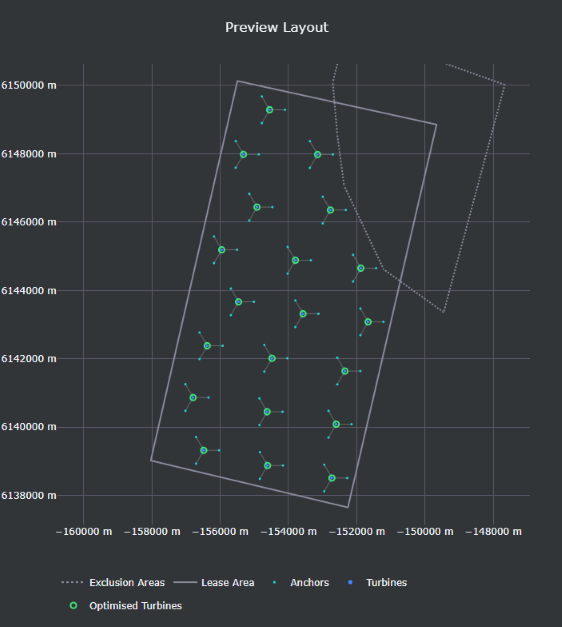
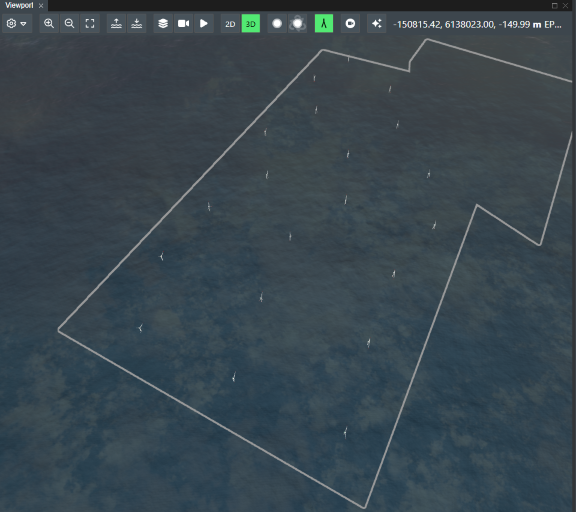
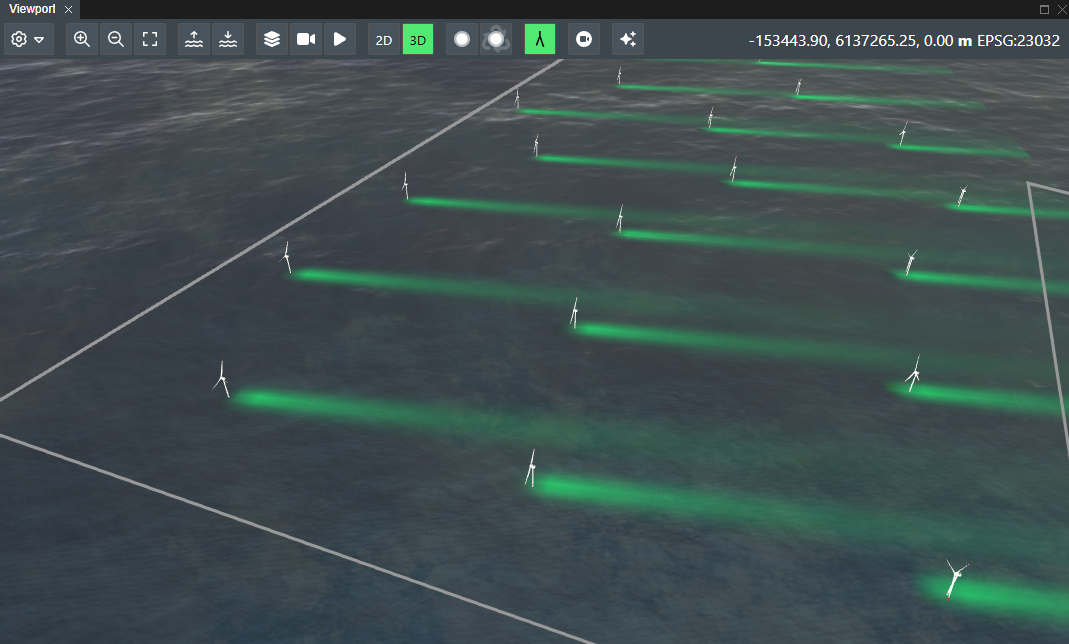
The current wind farm can be created in FieldTwin's viewport by clicking on the "Update Layout in Viewport" button. This process may take a few minutes depending on the wind farm's complexity.
The final result should be an identical wind farm, created in the 3D space of the viewport.
Optimization tab
The optimization tab contains four sections of configuration options:
- Simulation settings
- Optimization settings
- Flowmap
- Simulation, Optimization and Results
The "Simulation, Optimization and Results" section is identical to the one from the "Layout" tab.
Simulation settings
Clicking on the Simulation settings section opens this view.
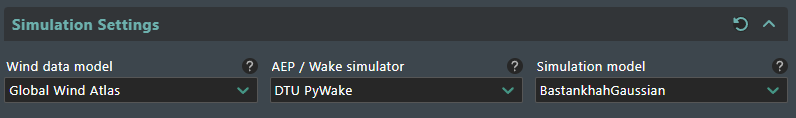
The Simulation settings section contains the following settings:
- Wind data model - allows for setting the wind data model for the wind farm.
- AEP / Wake simulator - allows for setting which simulation library should be used for the wind farm.
- Simulation model - allows for setting the simulation model used for the wind farm simulations.
Optimization settings
Clicking on the Optimization settings section opens this view.
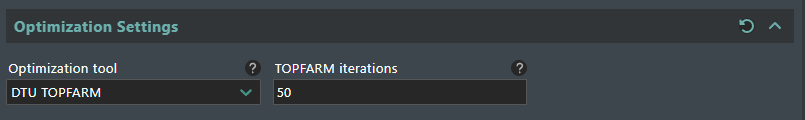
The Optimization settings section contains the following settings:
- Optimization tool - allows for setting the optimization tool used for the wind farm layout optimizations.
- TOPFARM iterations - allows for setting a number of iterations for the wind farm optimizations.
Flowmap
Clicking on the Flowmap section opens this view.
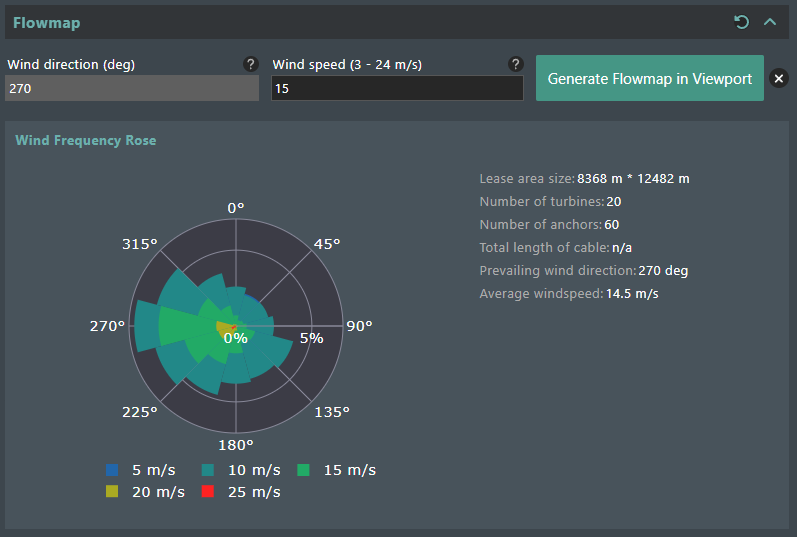
The Flowmap section contains the following settings:
- Wind direction (deg) - visualizes the wind direction based on the turbine orientation.
- Wind speed (3 - 24 m/s) - allows for setting the wind speed in meters per second for the flowmap. Only values between 3 and 24 m/s are valid.
The "Wind frequency Rose" provides a plot of the wind speeds in the lease area. Available is information about the lease area size, number of turbines, number of anchors, total length of cable, prevailing wind direction and the average wind speed.
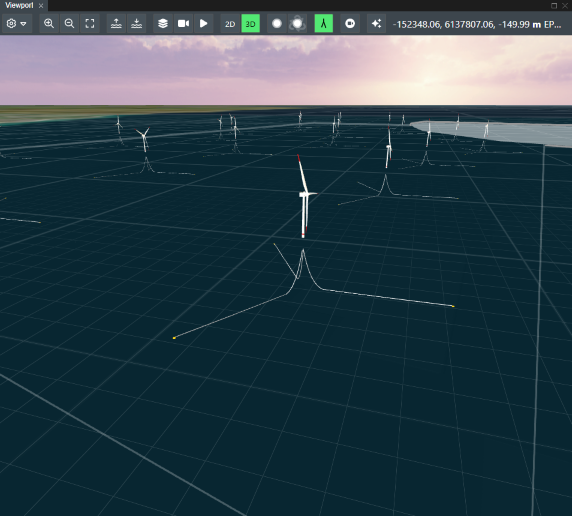
Clicking on the "Generate Flowmap in Viewport" generates a flowmap layer in FieldTwin's viewport.
The flowmap can be cleared from the viewport by clicking on the X icon next to the "Generate Flowmap in Viewport" button.
![]()
Results tab
Clicking the Results tab opens this view:
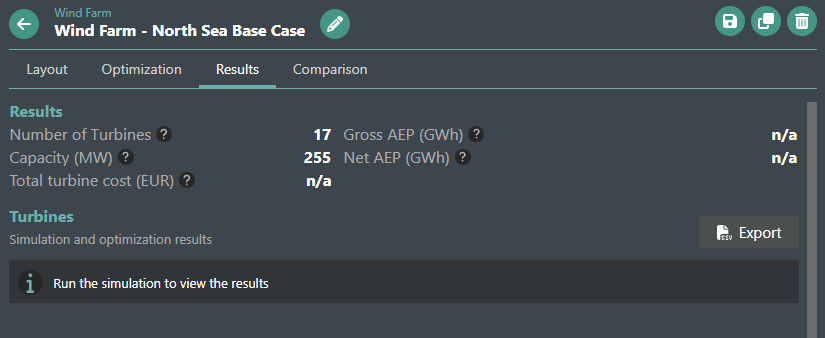
Results
Under the Results section, the following fields are visible:
- Number of Turbines - the total count of turbines located within the boundary.
- Capacity (MW) - the total capacity of the farm based on the turbine count and the rated power of the selected asset.
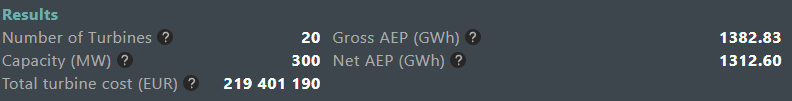
- Total turbine cost (EUR) - the total production cost of all turbine assets in Euro. The total turbine cost is calculated after a Simulation is performed.
- Gross AEP (GWh) - the calculated annual energy production (AEP) of the whole farm including the wake loss.
- Net AEP (GWh) - the calculated annual energy production (AEP) of the whole farm with the wake loss subtracted.
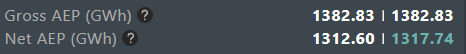
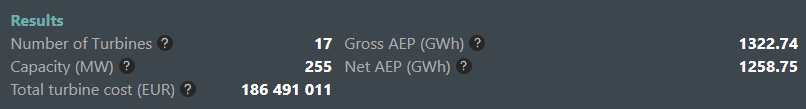
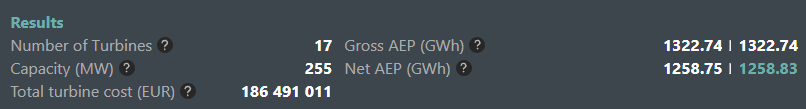
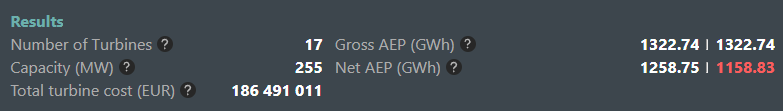
When both Simulation and Optimization are performed, their AEP results are separated by a divider. If the optimized AEP values are more optimal than the simulated ones: the values will be colored in green. Otherwise, if the values are less optimal they will be colored in red.
Results section after running a Simulation:
Results section after running an Optimization (with positive results):
Results section after running an Optimization (with negative results):
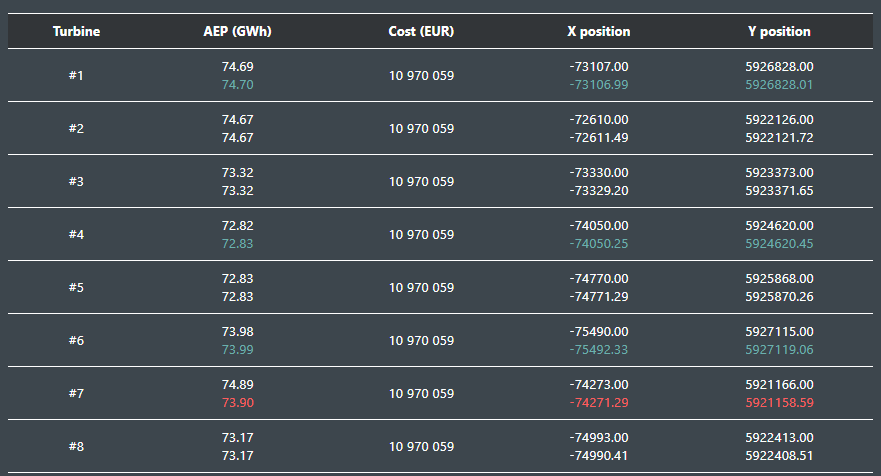
Turbines
Under the Turbines section, after a Simulation has been performed the following content will be visible:
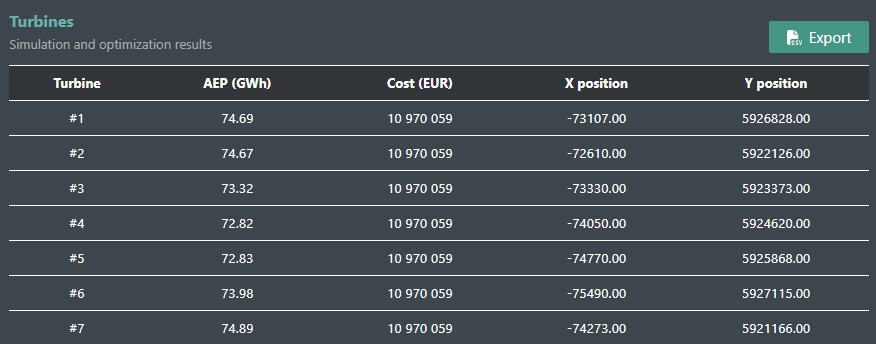
The grid contains individual data from the performed Simulation for each of the turbines in the farm. By clicking on a row you can mark that exact turbine in the preview plot on the left (if an optimization has been performed, the optimized position will be marked as well):
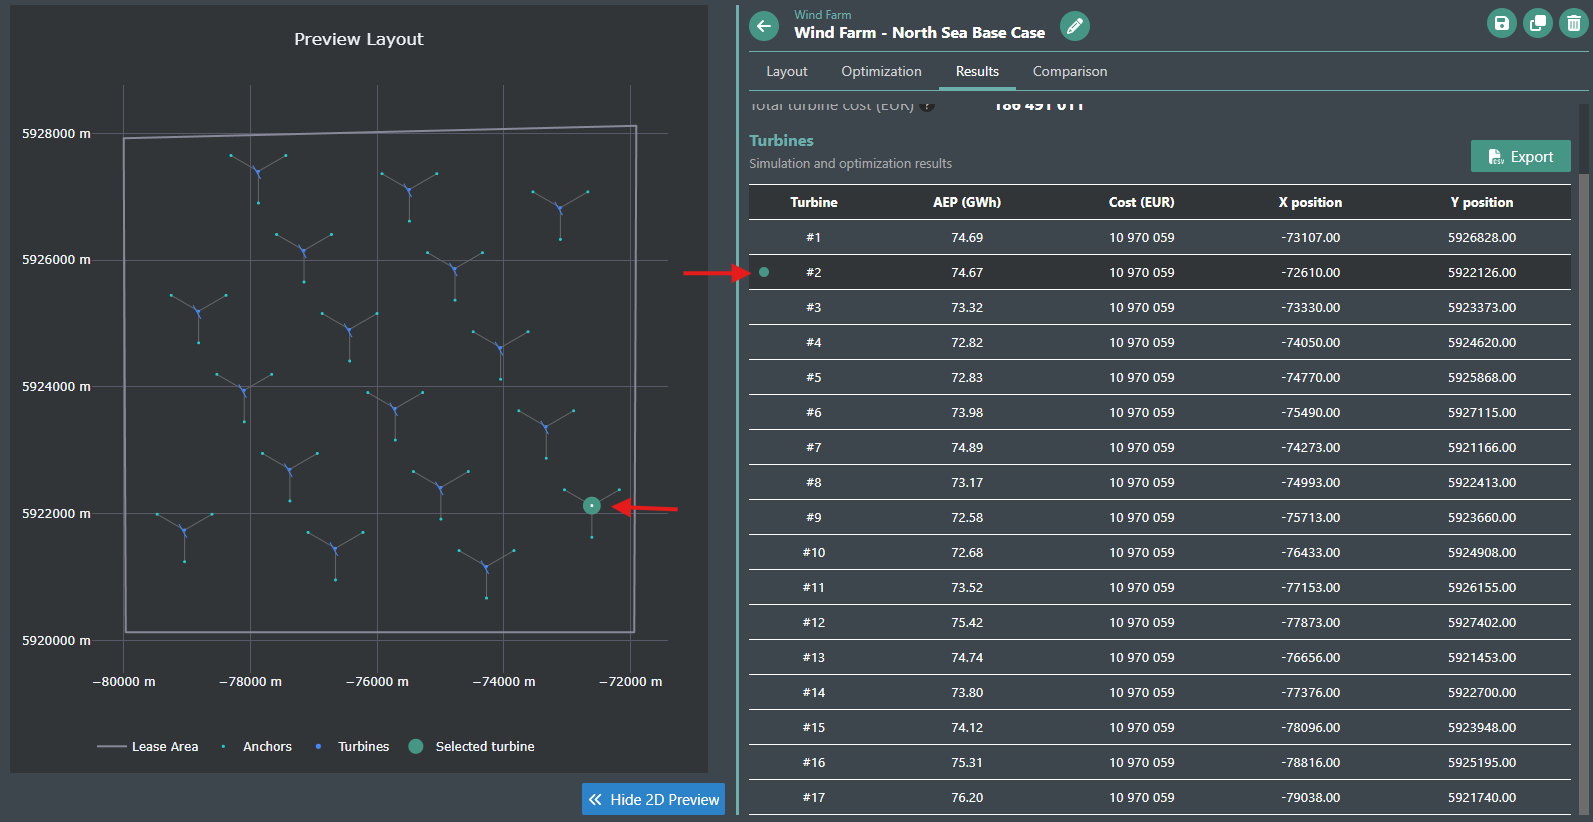
There is also an option to click the turbines from the Preview which will mark the row and show the data for the selected turbine in the Results grid.
After Optimization, optimized AEP and coordinates appear below the simulation values, again being colored in green if the optimized AEP is more than the simulated AEP, and in red if it's less:
There is a possibility to export the data from the grid to a .csv file by clicking the now active Export button visible on the right:

Comparison tab
Clicking the Comparison tab opens this view:
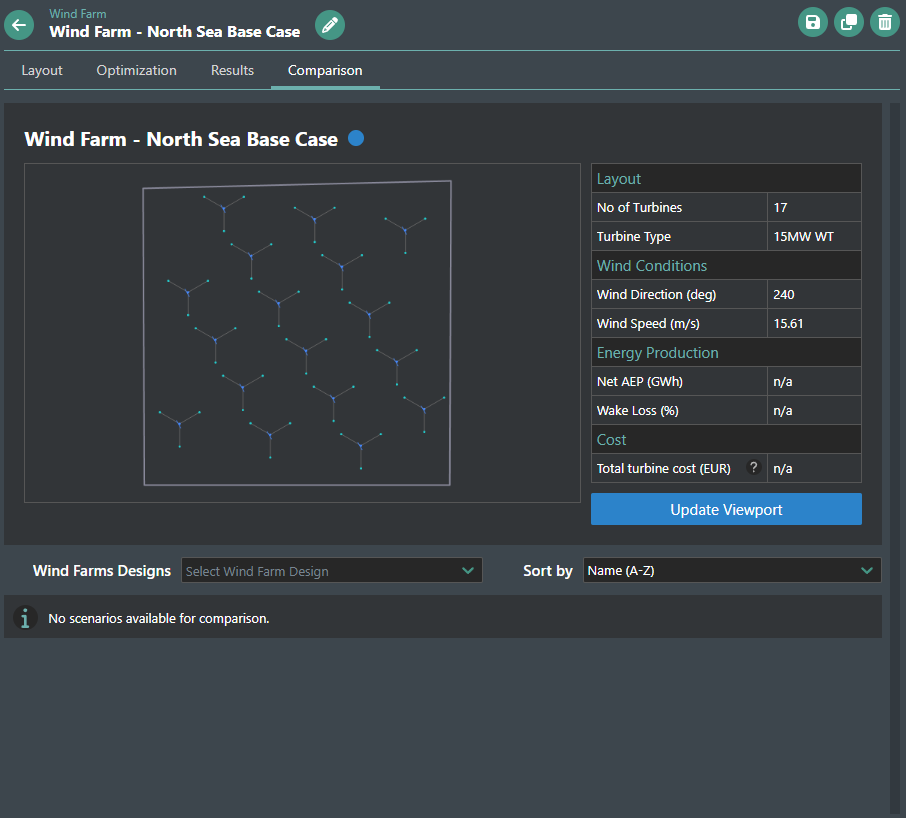
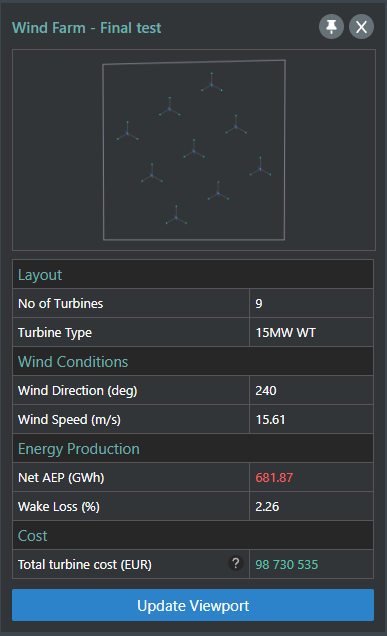
The base comparison preview initially shows the current Wind Farm that is being edited in the Integration. The farm data (and preview) can be changed to a different design from the current sub-project, which is why the current one is also indicated by a blue dot on the right of the name.
The left section visualizes the wind farm layout, showing turbine positions relative to one another.
The right section provides an overview of key parameters:
- No of Turbines - the total count of turbines located within the boundary.
- Turbine Type - the total capacity of the farm based on the turbine count and the rated power of the selected asset.
- Wind Direction (deg) - the prevailing wind direction for the selected boundary.
- Wind Speed (m/s) - the prevailing wind velocity for the selected boundary.
- Net AEP (GWh) - the calculated annual energy production (AEP) of the whole farm with the wake loss substracted.
- Wake Loss (%) - the value of the calculated wake loss in percent.
- Total turbine cost (EUR) - the total production cost of all turbine assets in Euro.
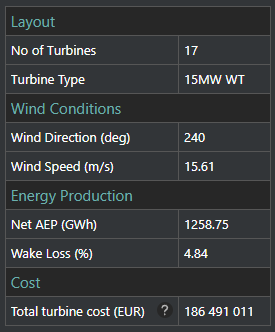
After running a Simulation, the fields will be automatically populated with the results:
Clicking the Update Viewport button will apply the turbine layout to FieldTwin:

Following is an option to select different Wind Farm designs from the current sub-project, and visualize them in the lower-half of the tab for quick comparison (the selected designs can be sorted by Name, Net AEP, Wake Loss and Cost):
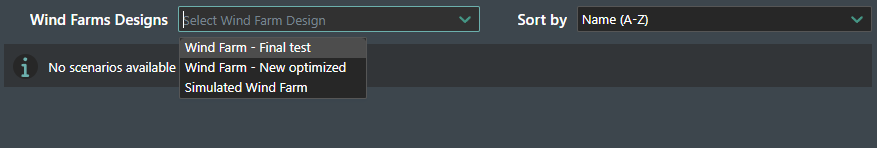
Each of the selected designs will show their own respective data. If the Net AEP or Total turbine cost is more or less optimal than that of the farm loaded in the main preview - it will be highlighted either in green or red. Clicking the Update Viewport button will directly apply the Wind Farm design to FieldTwin.
The Pin button can be used to load a Farm Design into the top comparison preview.

Once a design is pinned, its Net AEP and Total turbine cost values are set as the baseline for comparison. The highlighted fields of the other compared items will then be dynamically adjusted relative to the pinned design.
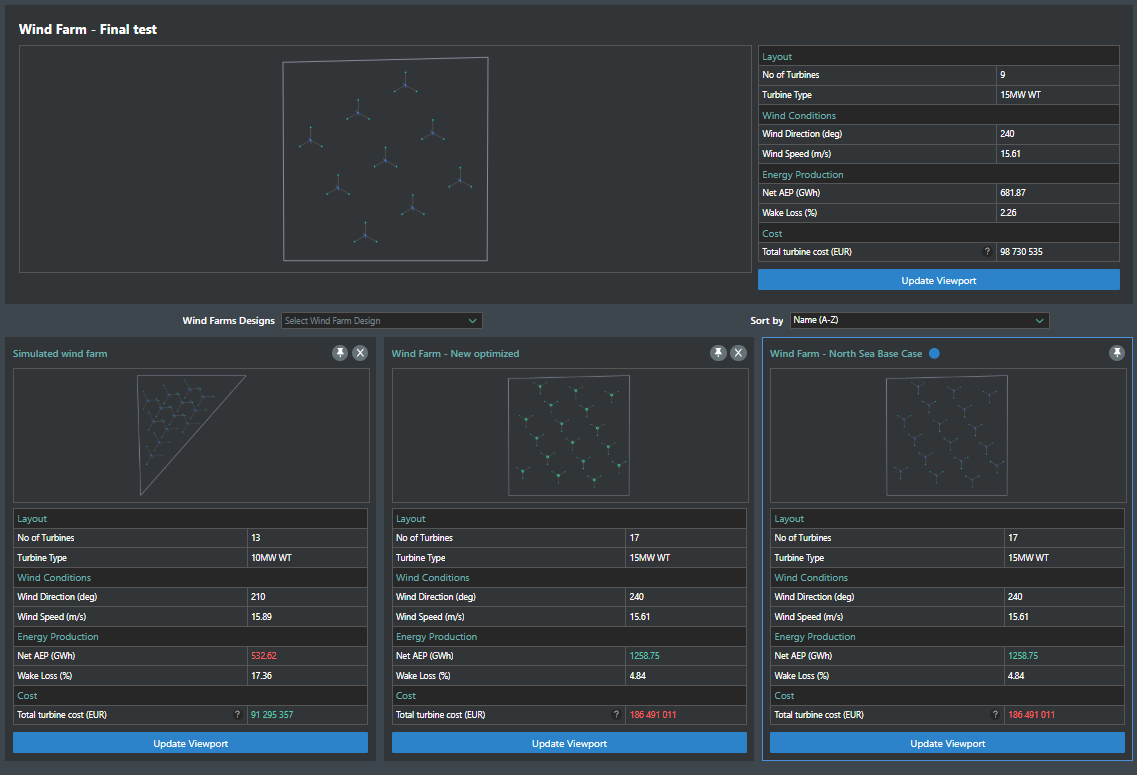
A Farm Design can be completely removed from the Comparison tab by clicking the X button.
